Intro to Data AnalysisiNaturalist dataInstructions to download iNaturalist dataAnalyzing dataExample of analyzing iNaturalist data using R
Figure 1
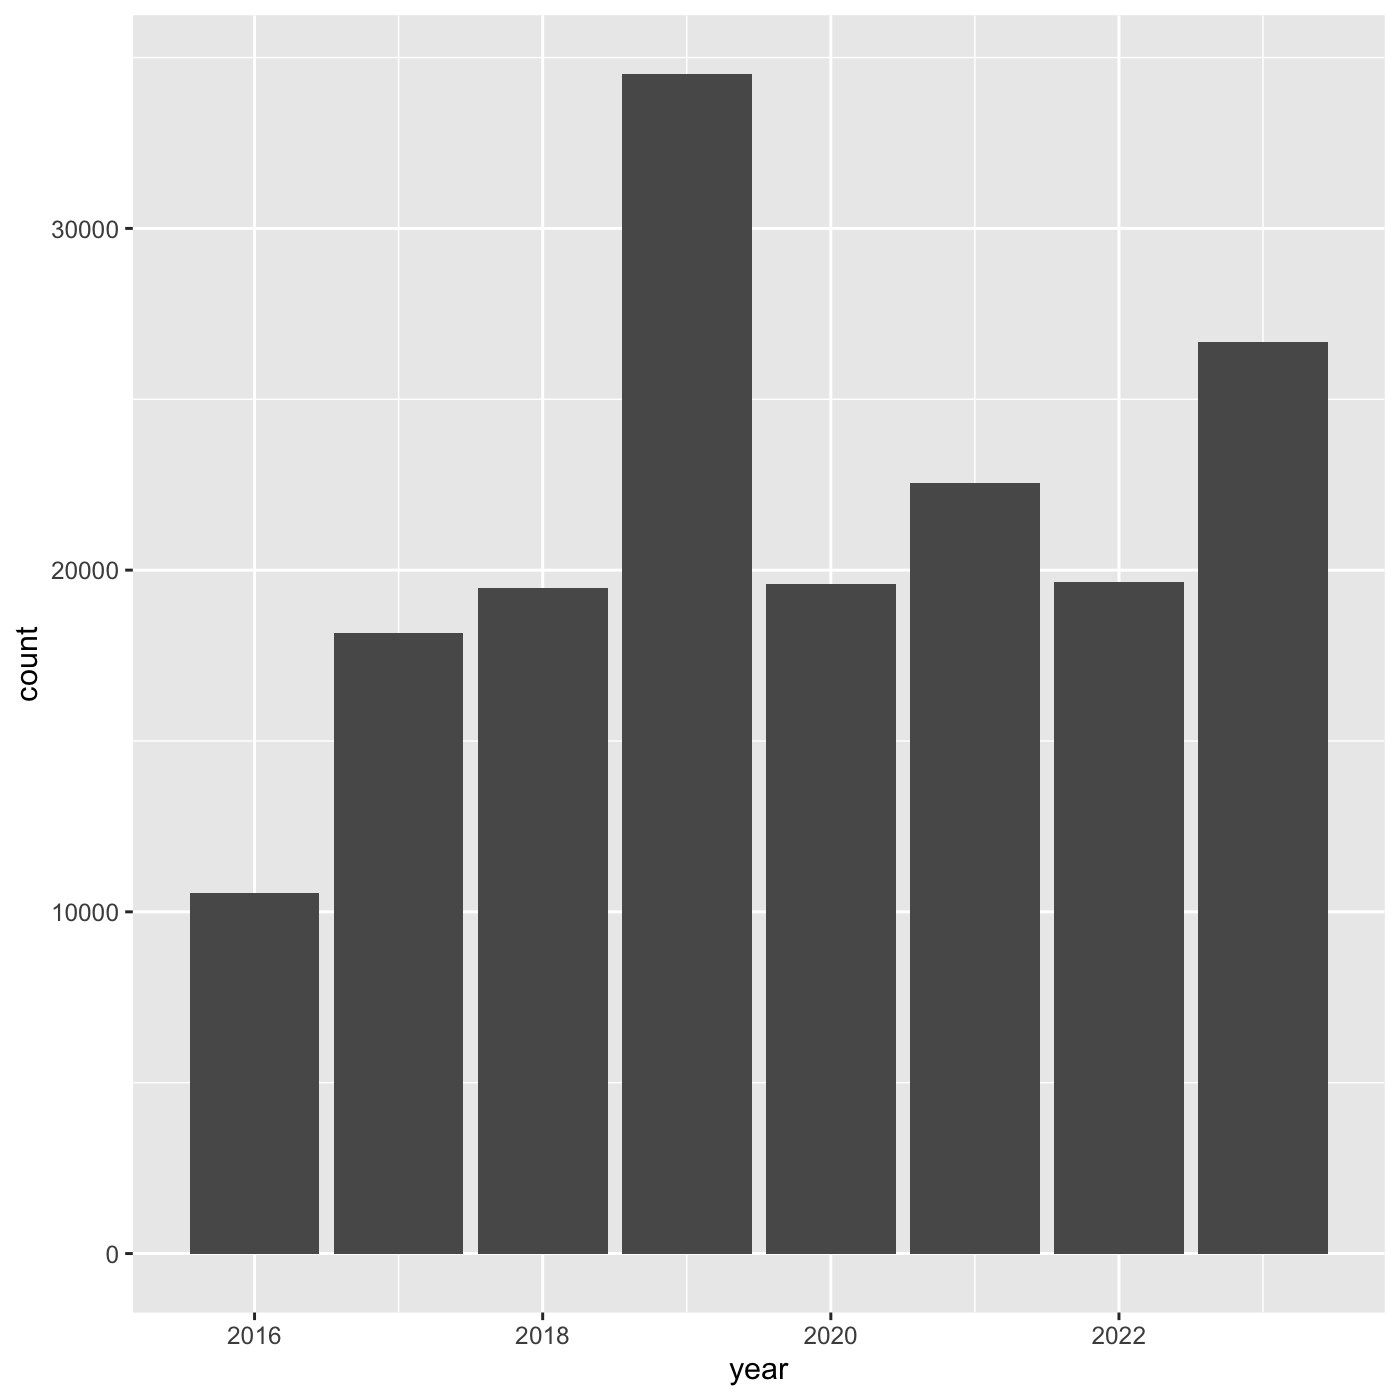
Figure 2
Introduction to R and RStudioGetting set up in RStudio
Figure 1
Exploring and understanding data
Working with data
Data visualization with ggplot2
Figure 1

Figure 2
 Next we need to specify how we want the data to be displayed. We do this
using
 geom_ functions, which specify the type of geometry
we want, such as points, lines, or bars. We use geom_bar()
to create a vertical bar plot.
Figure 3
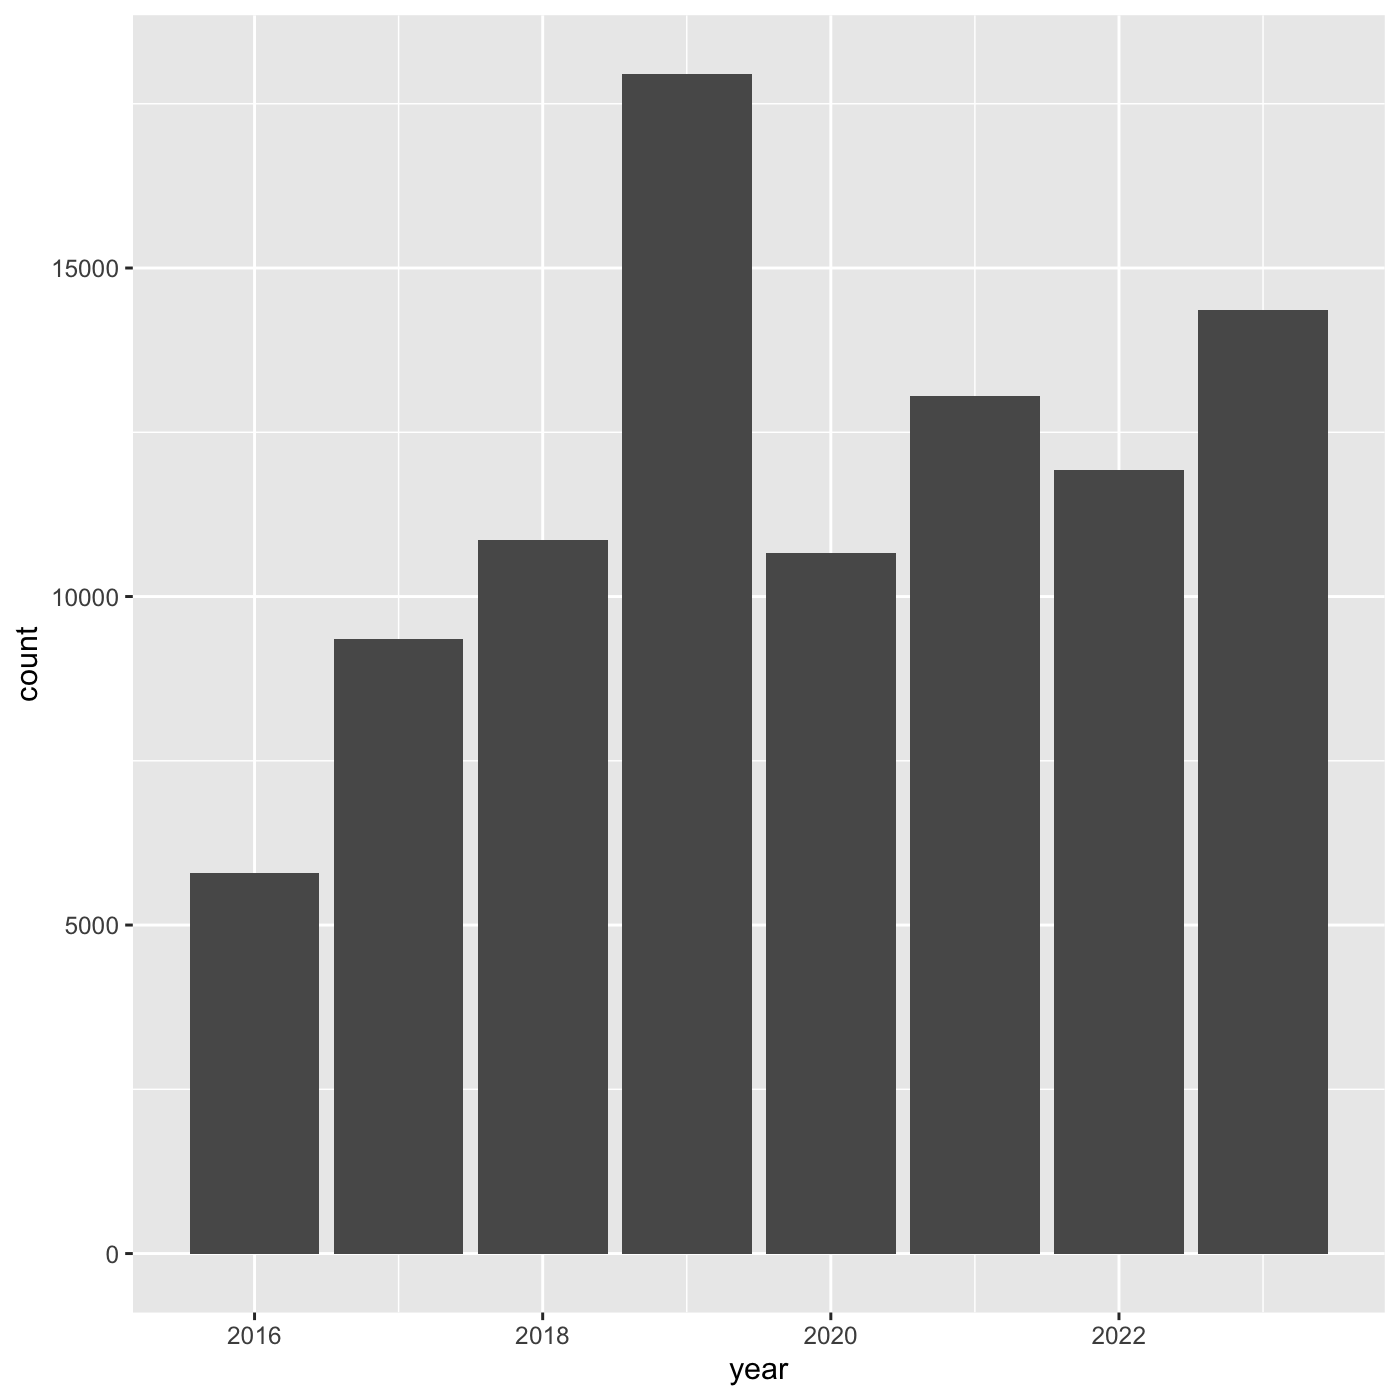 If we want year on x axis, and count on y axis, use
coord_flip()
Figure 4
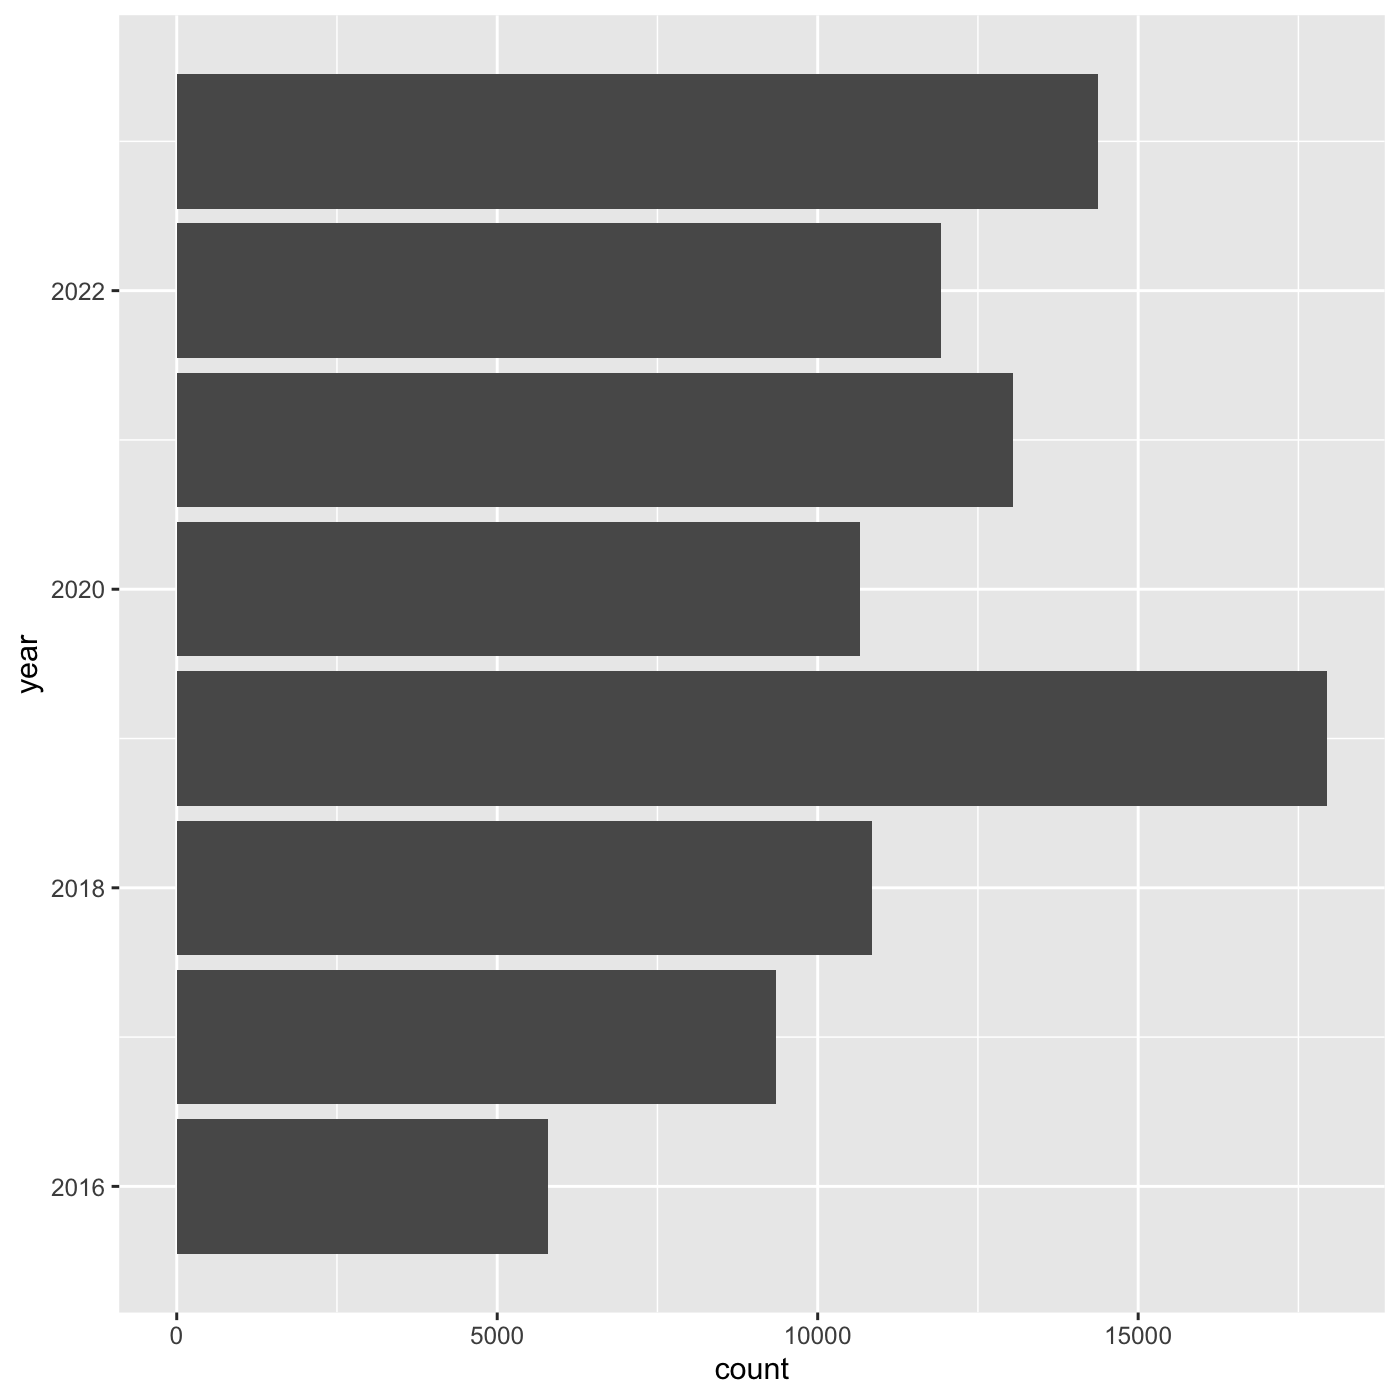
Figure 5
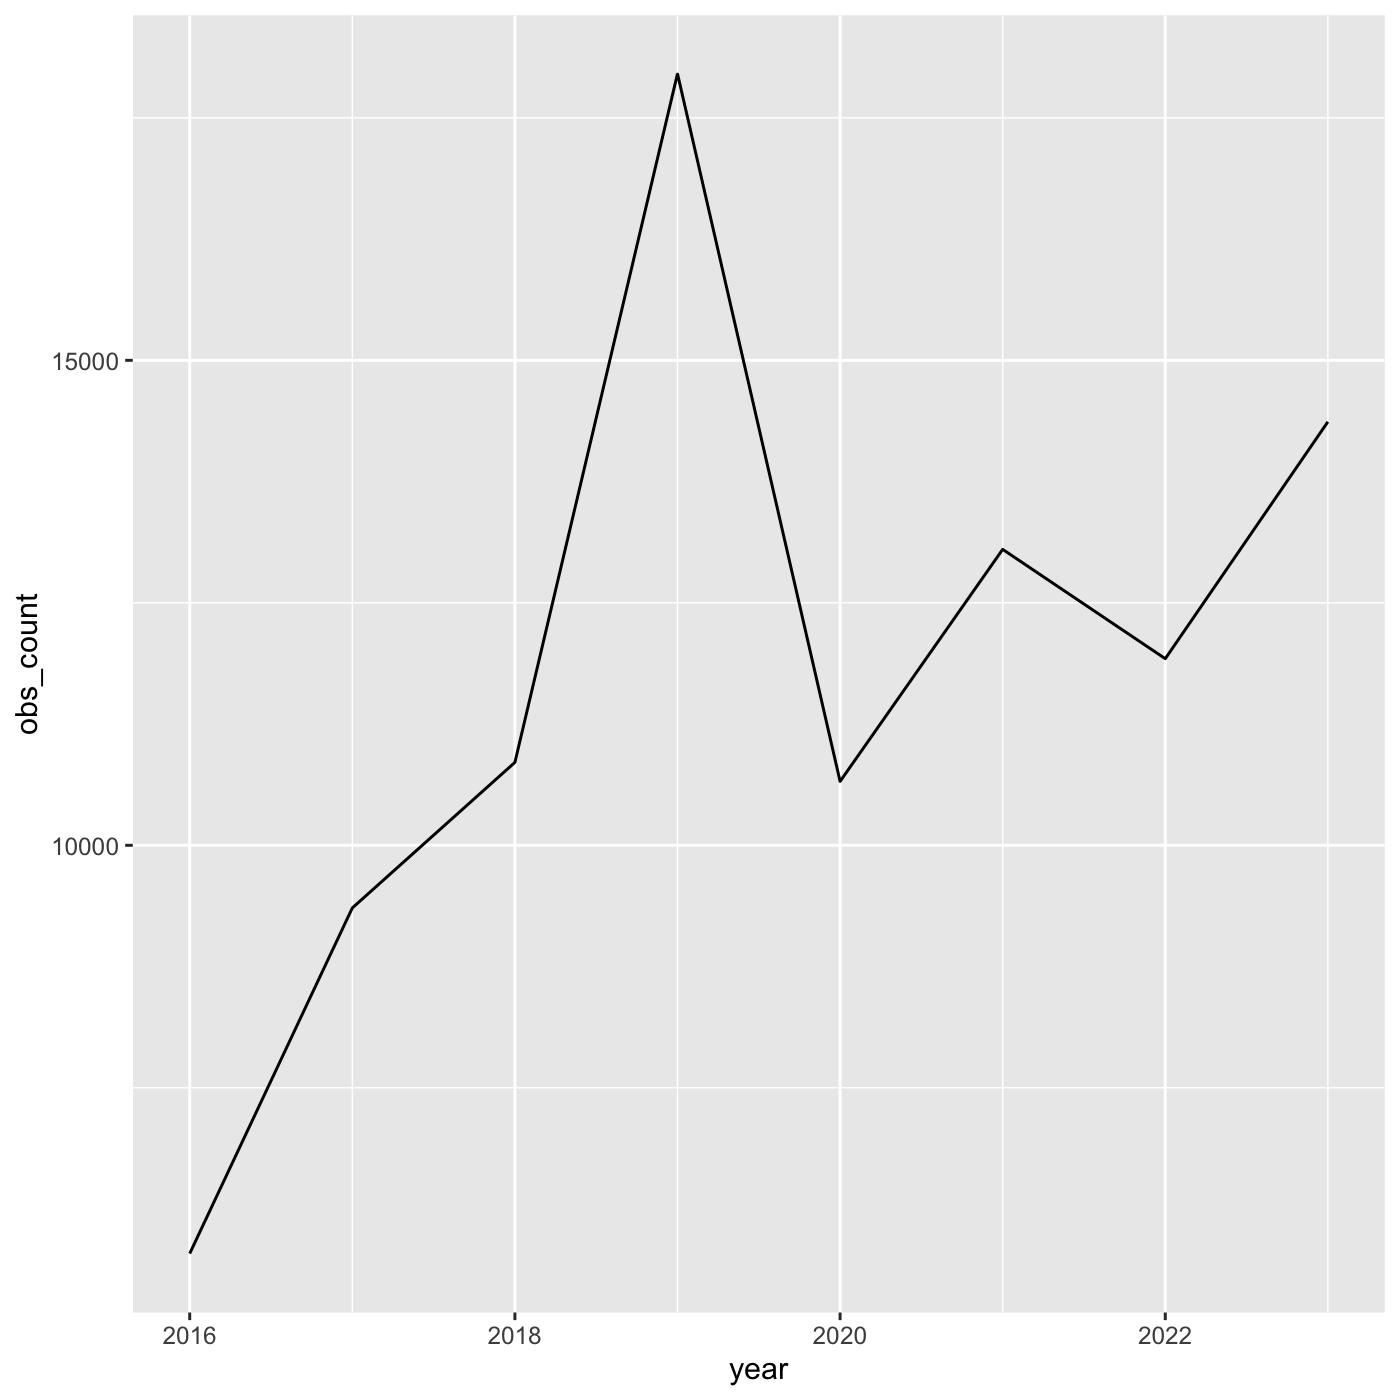
Figure 6
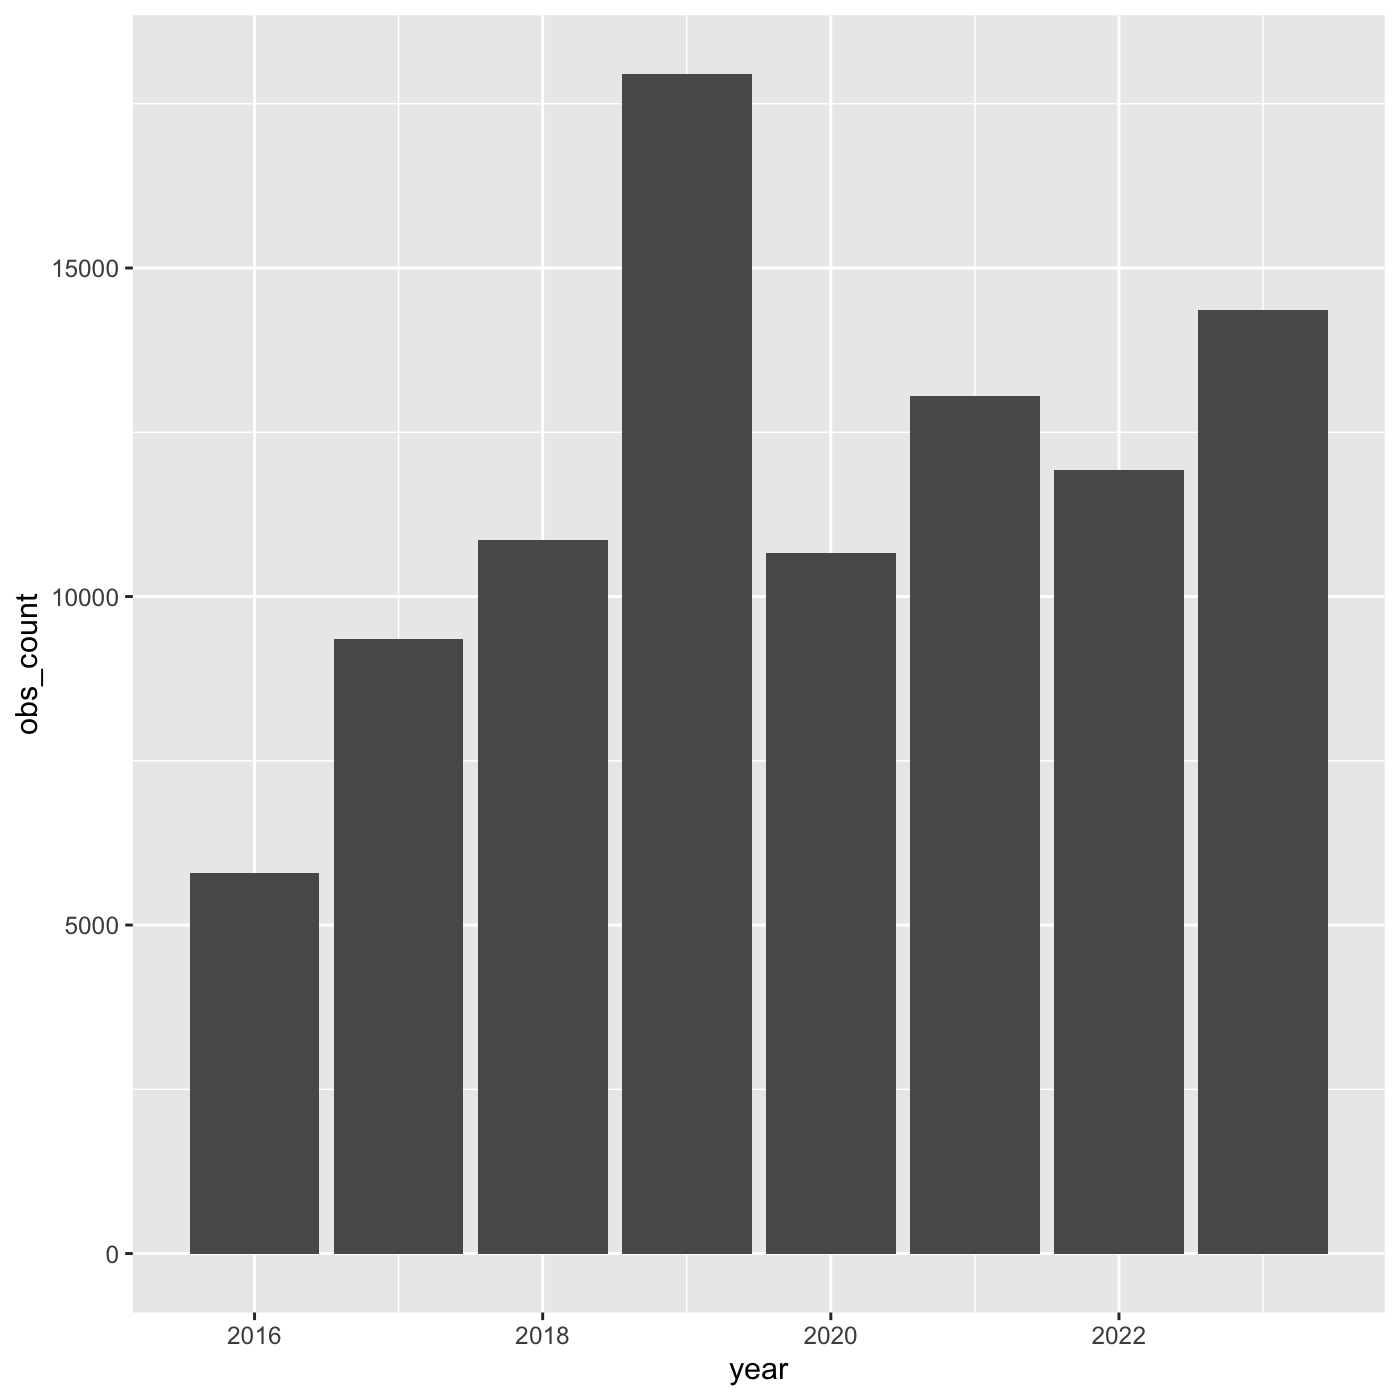
Figure 7
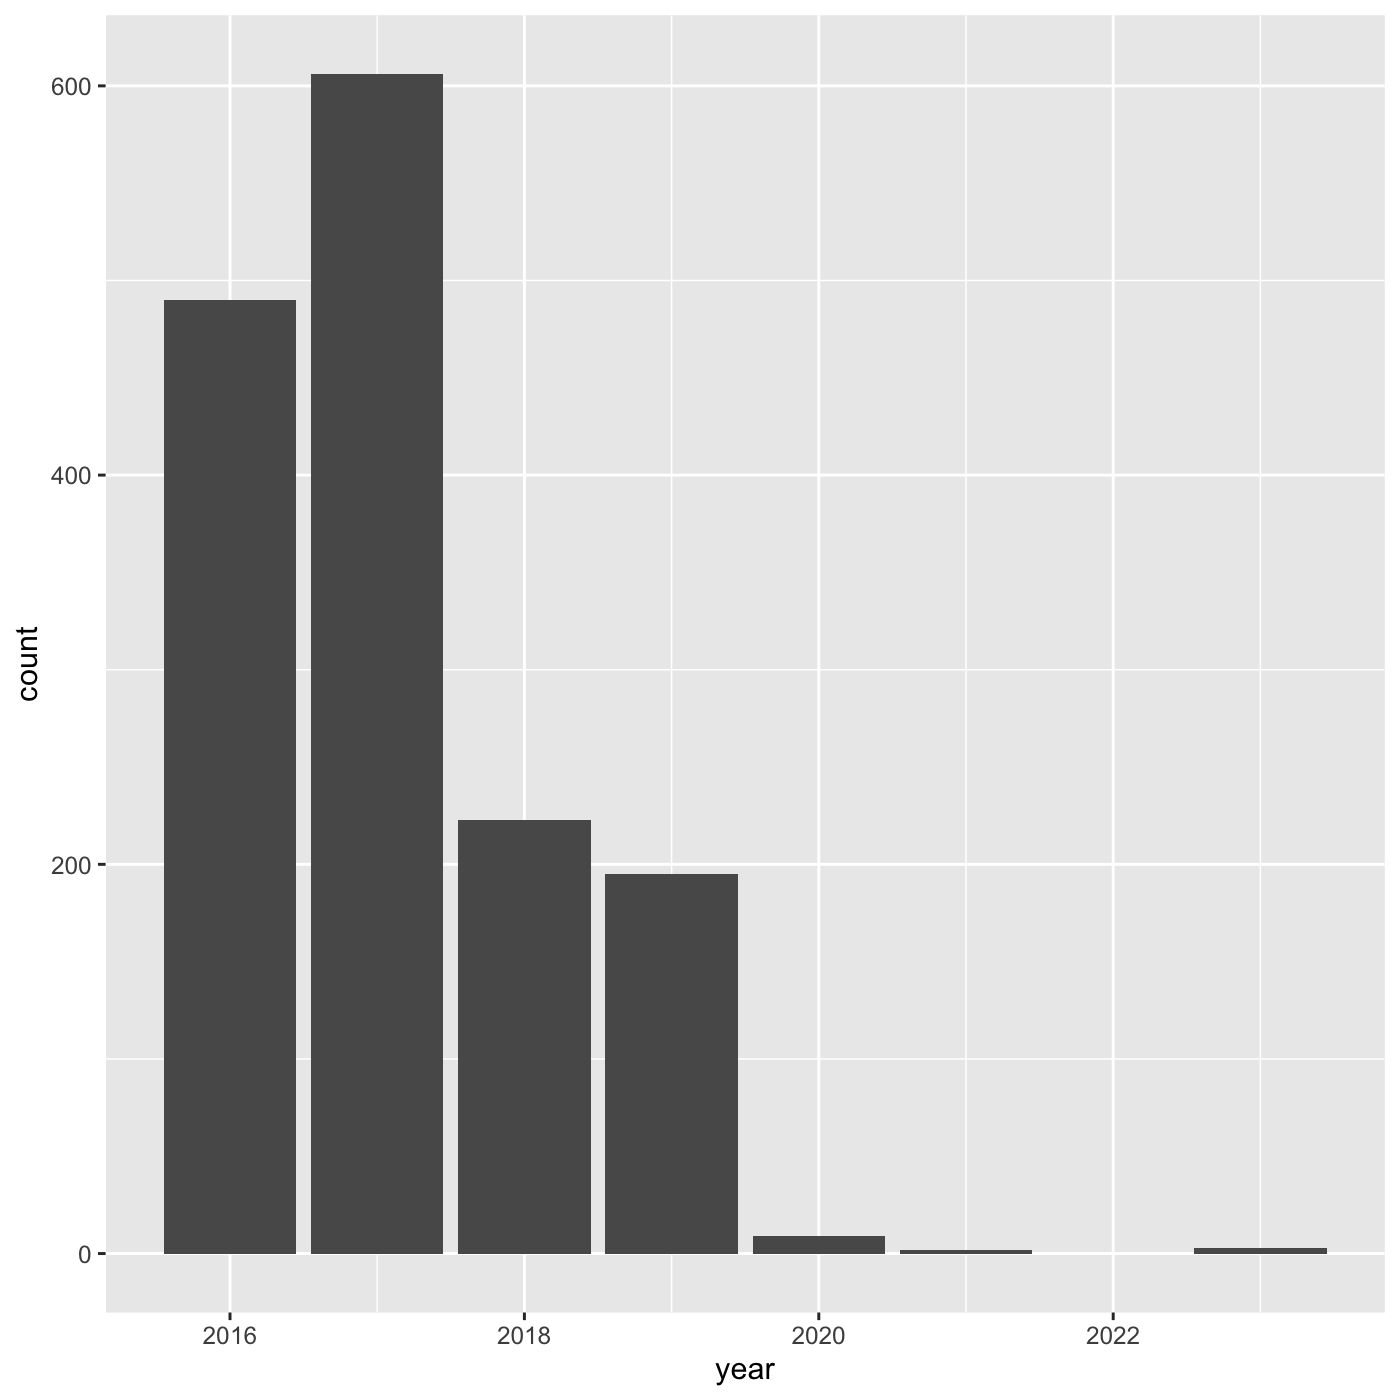
Figure 8
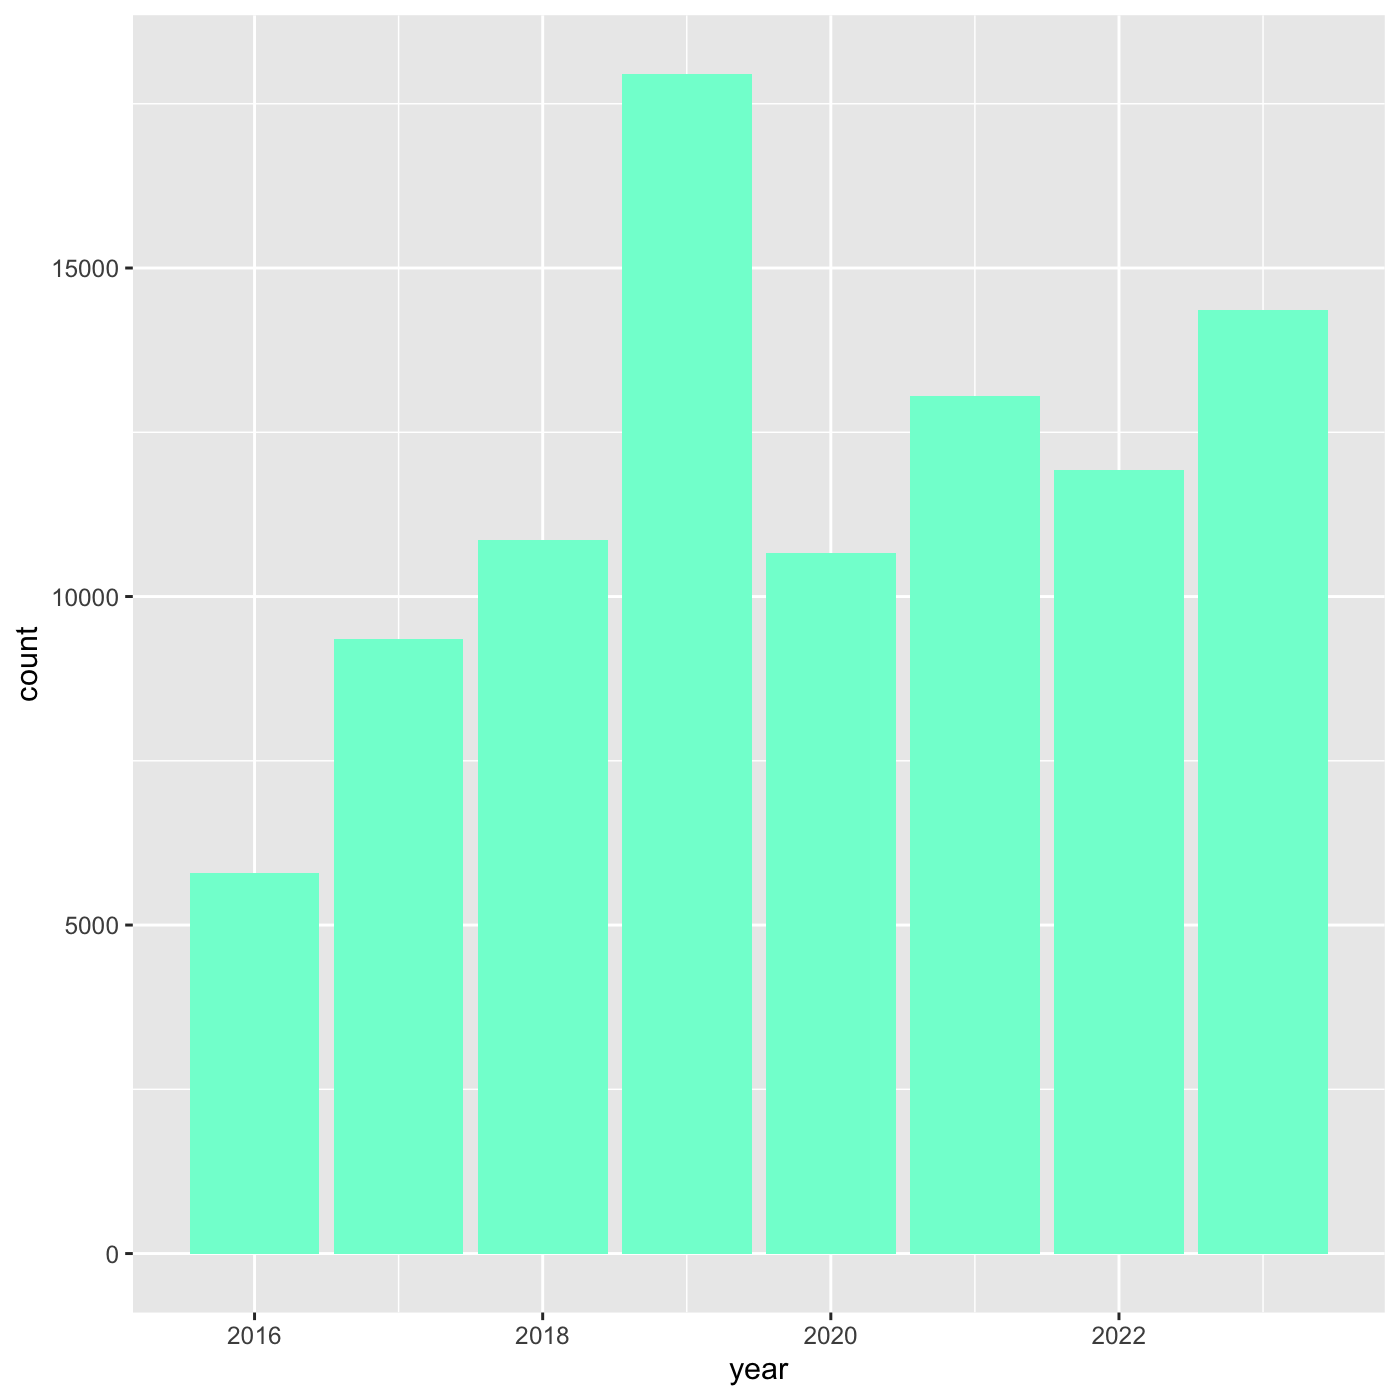 We can also use 6 digit hex color. You can use online tools to get hex
colors. https://html-color.codes
Figure 9
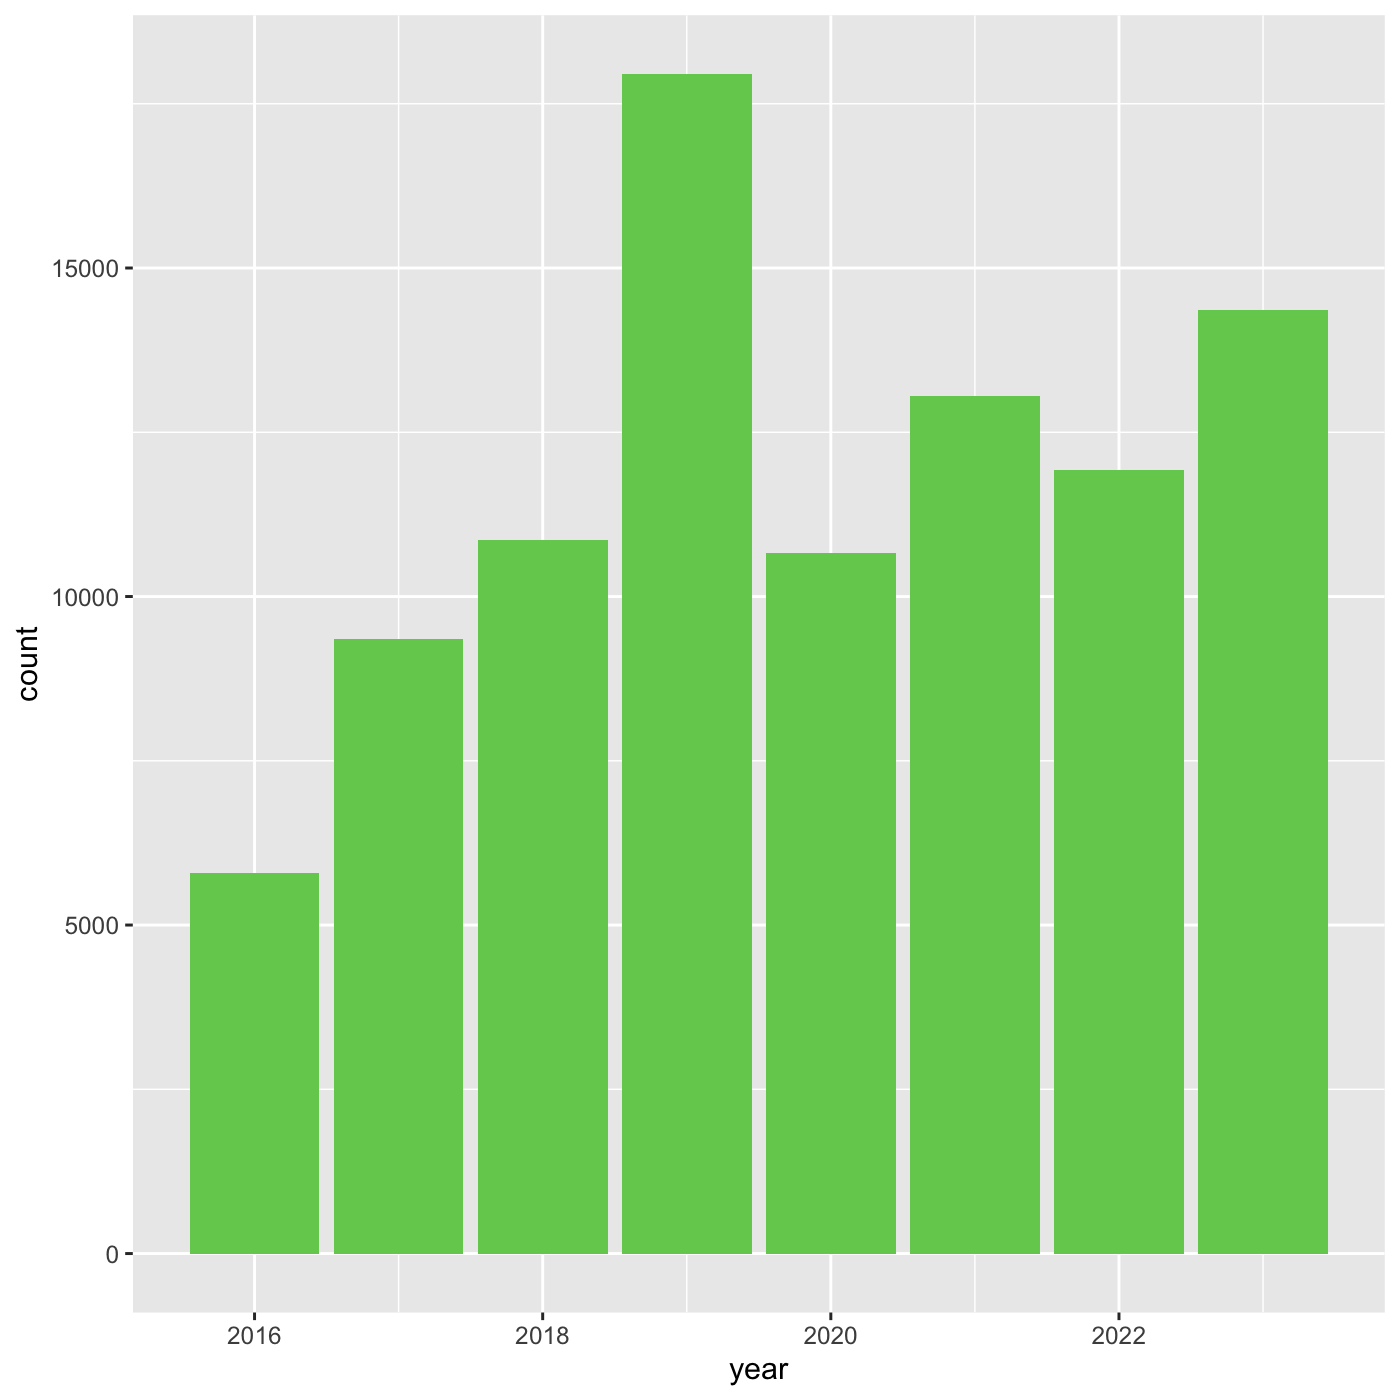
Figure 10
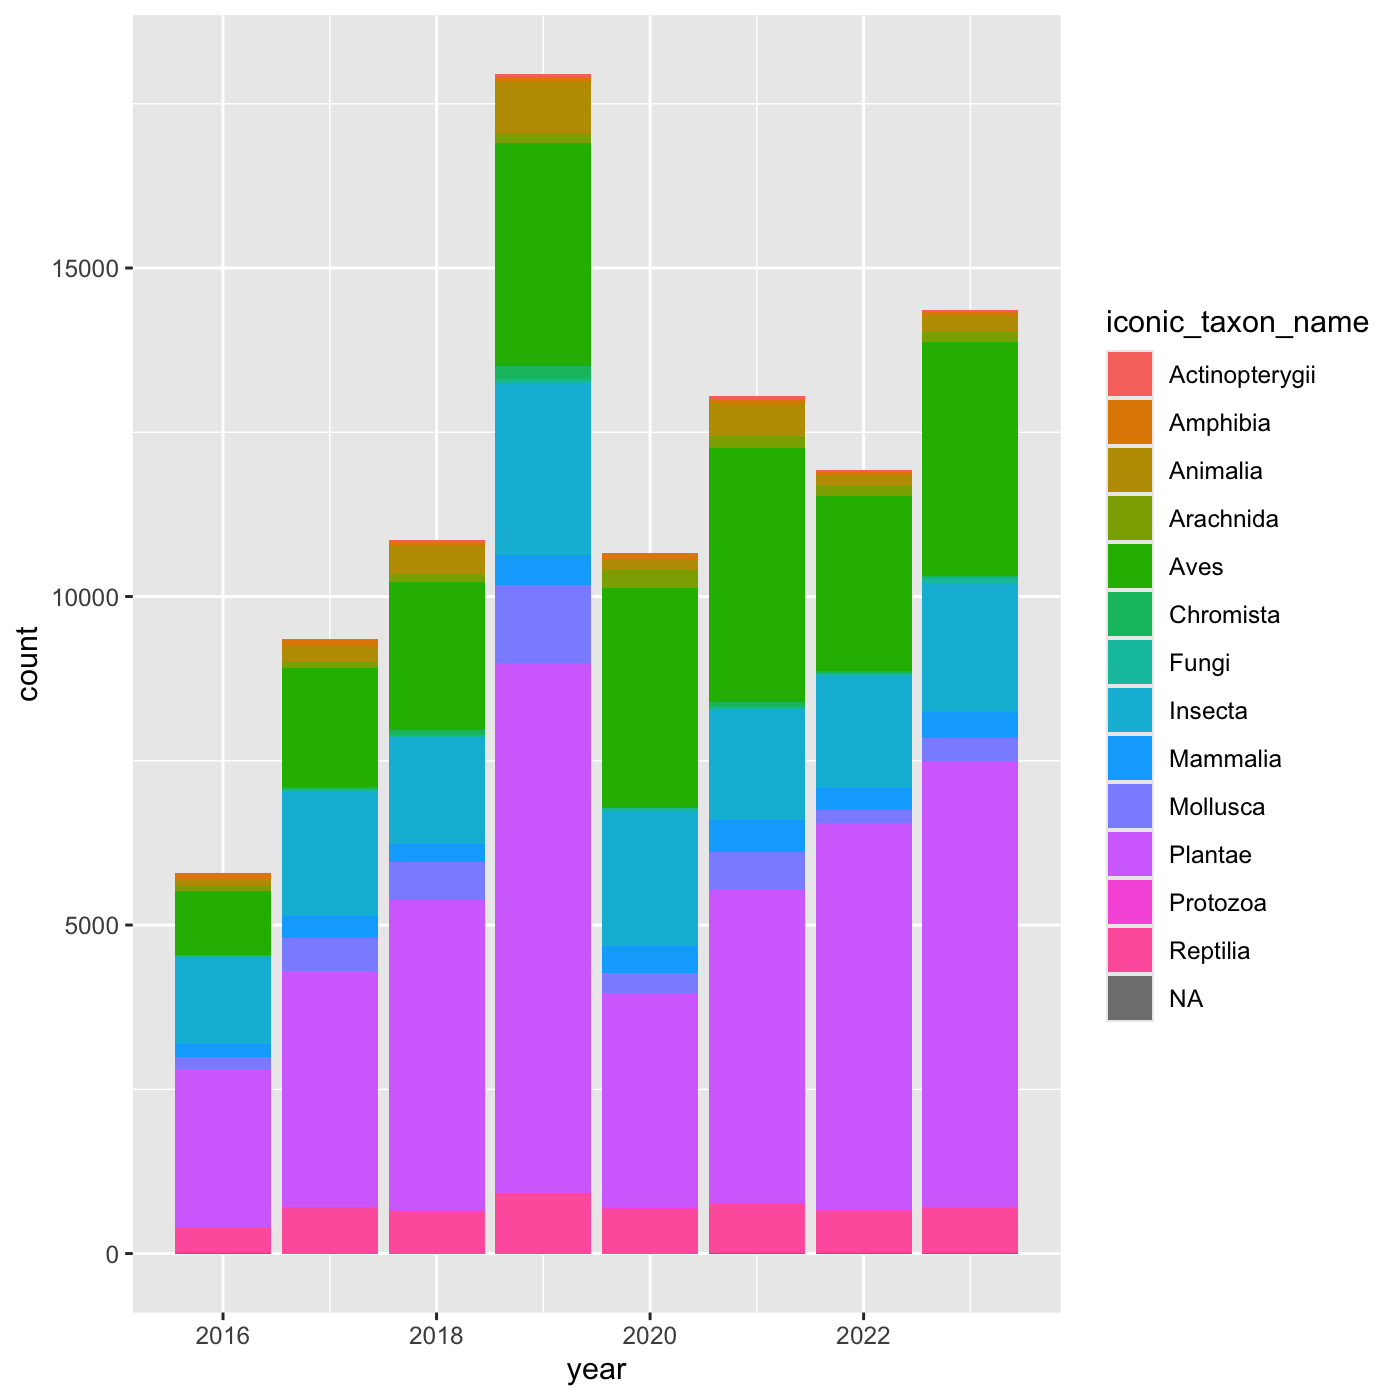 We create a new dataframe that counts the number observations per year
and iconic_taxon_name. Use
 mutate() and year()
to add a year column. We want count by both
year and iconic_taxon_name. We want the column
to be called obs_count.
Figure 11
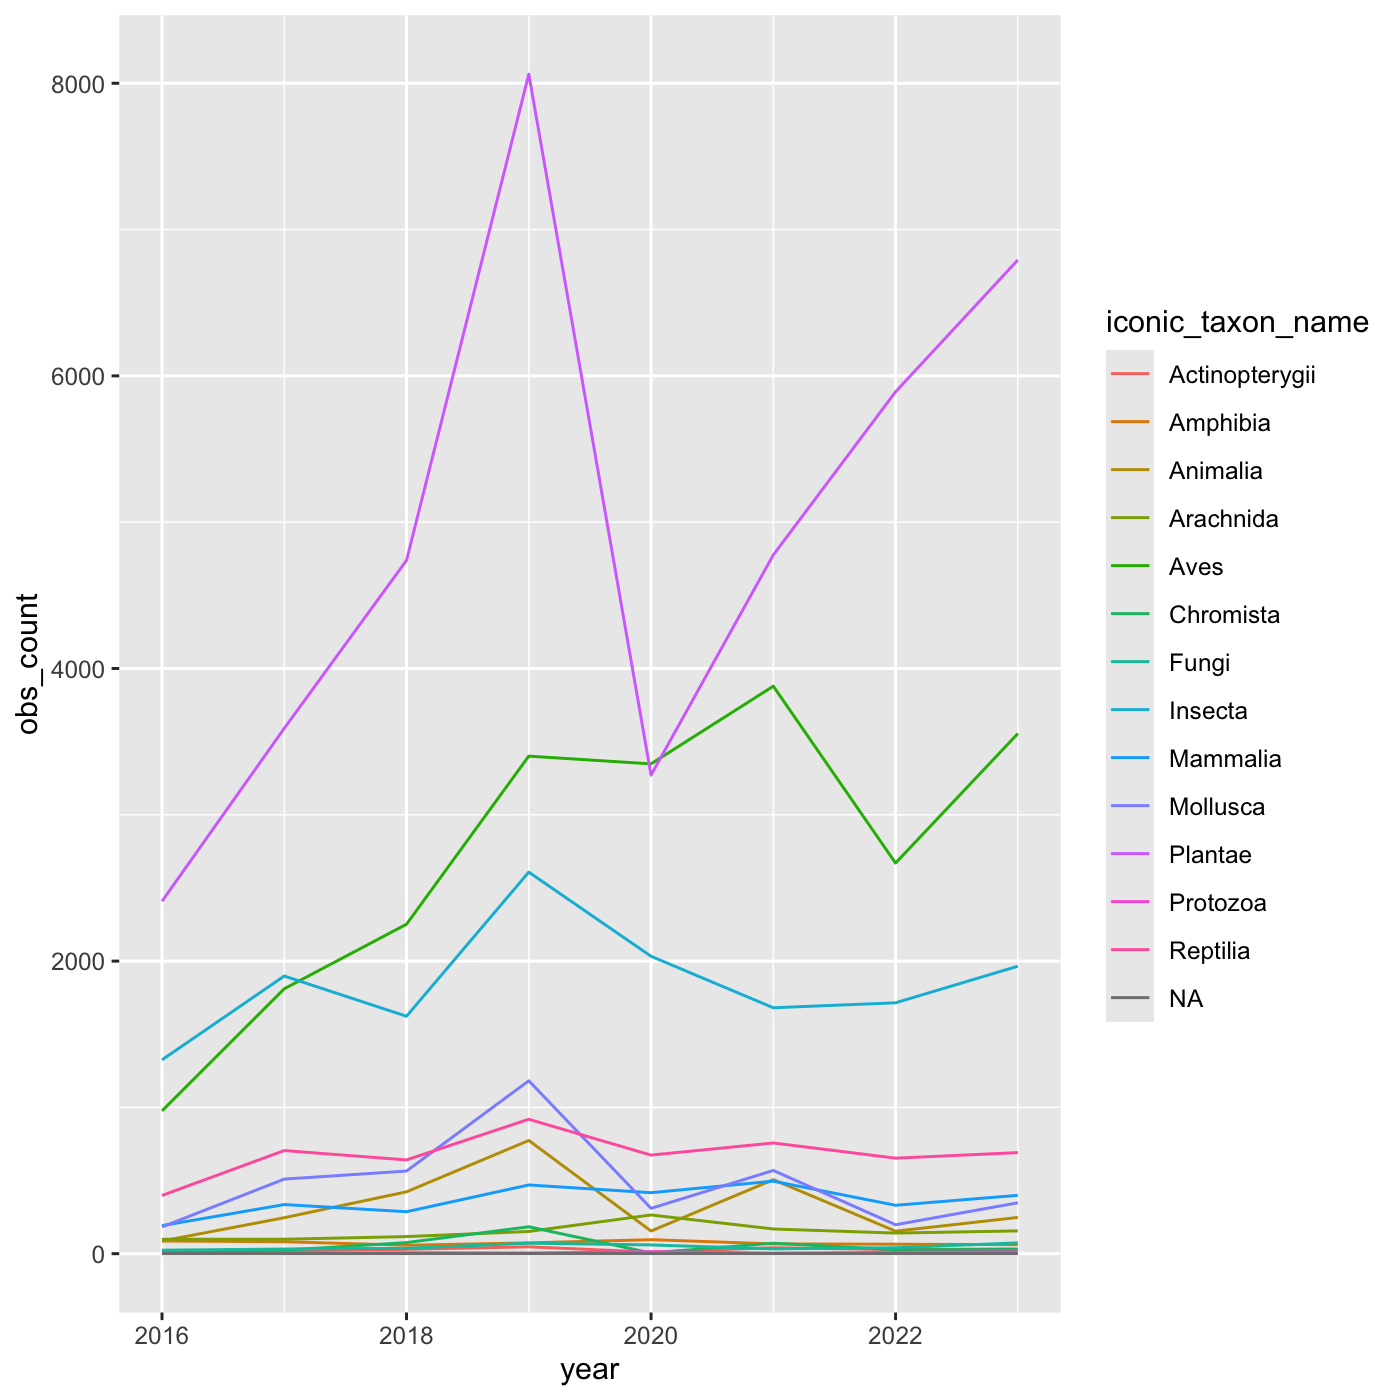
Figure 12
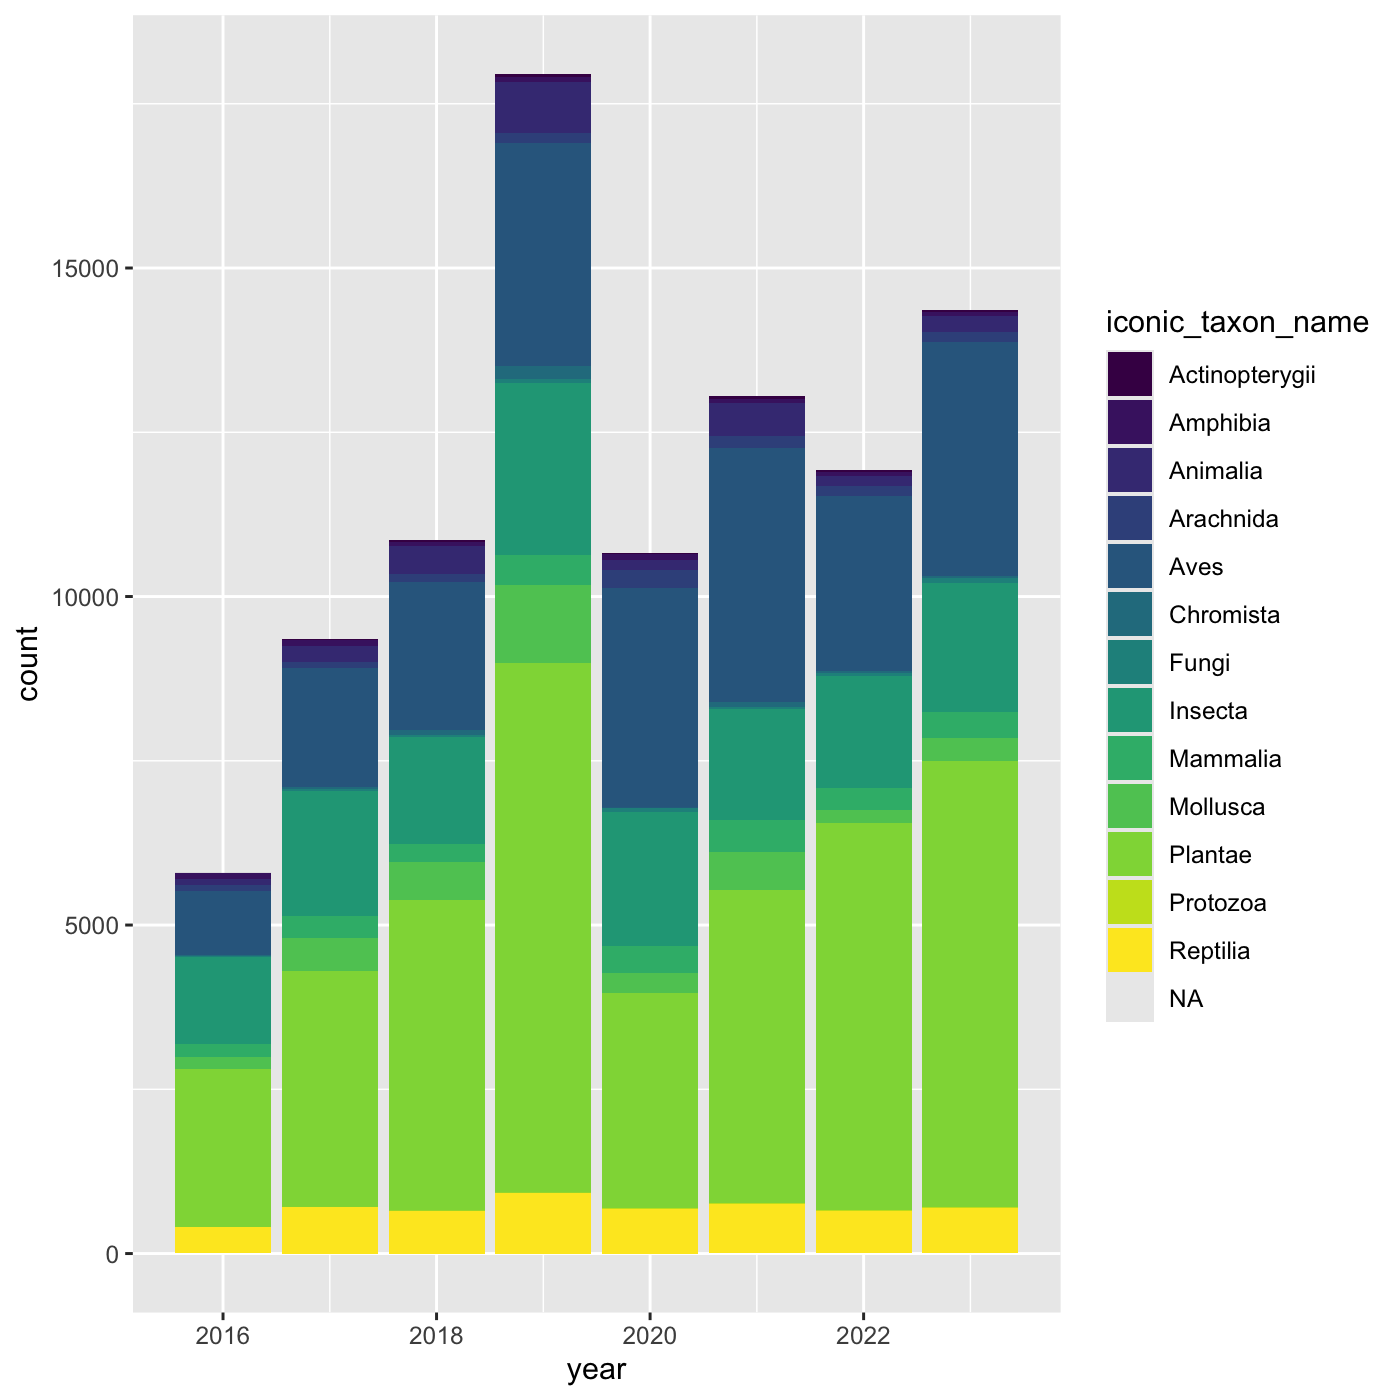
Figure 13
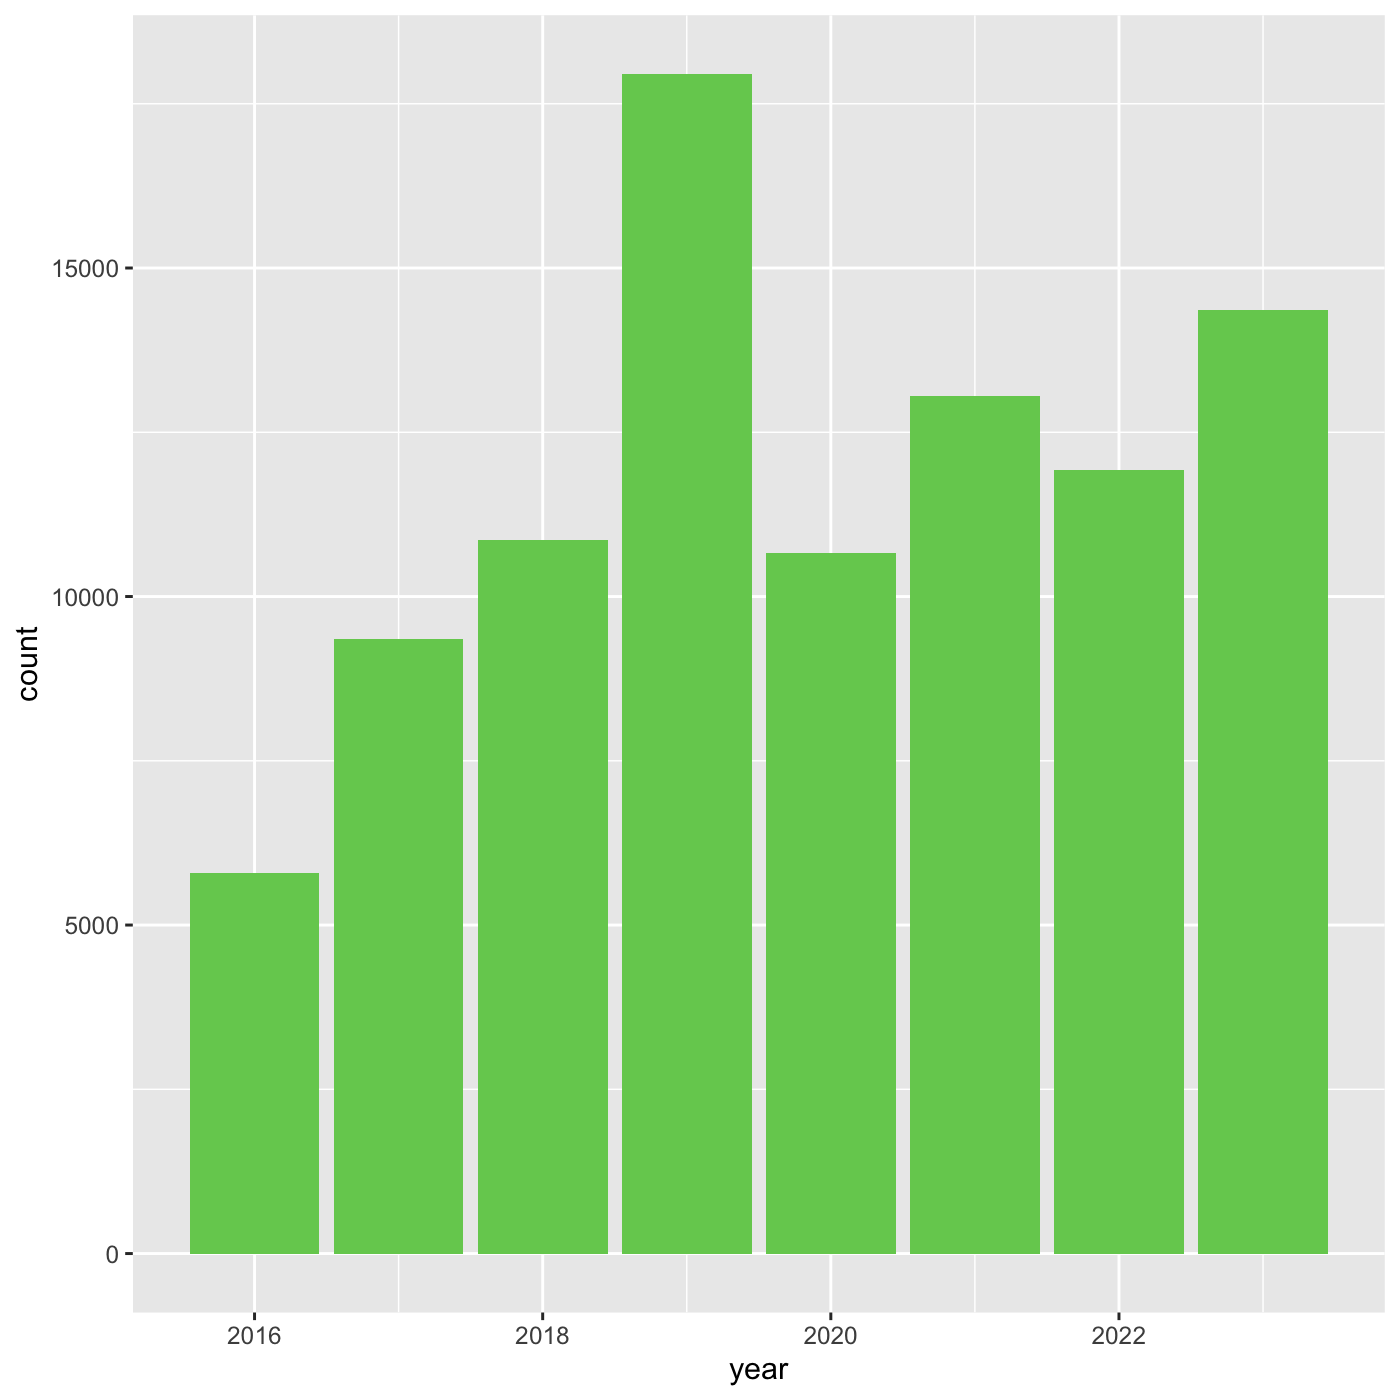
Figure 14
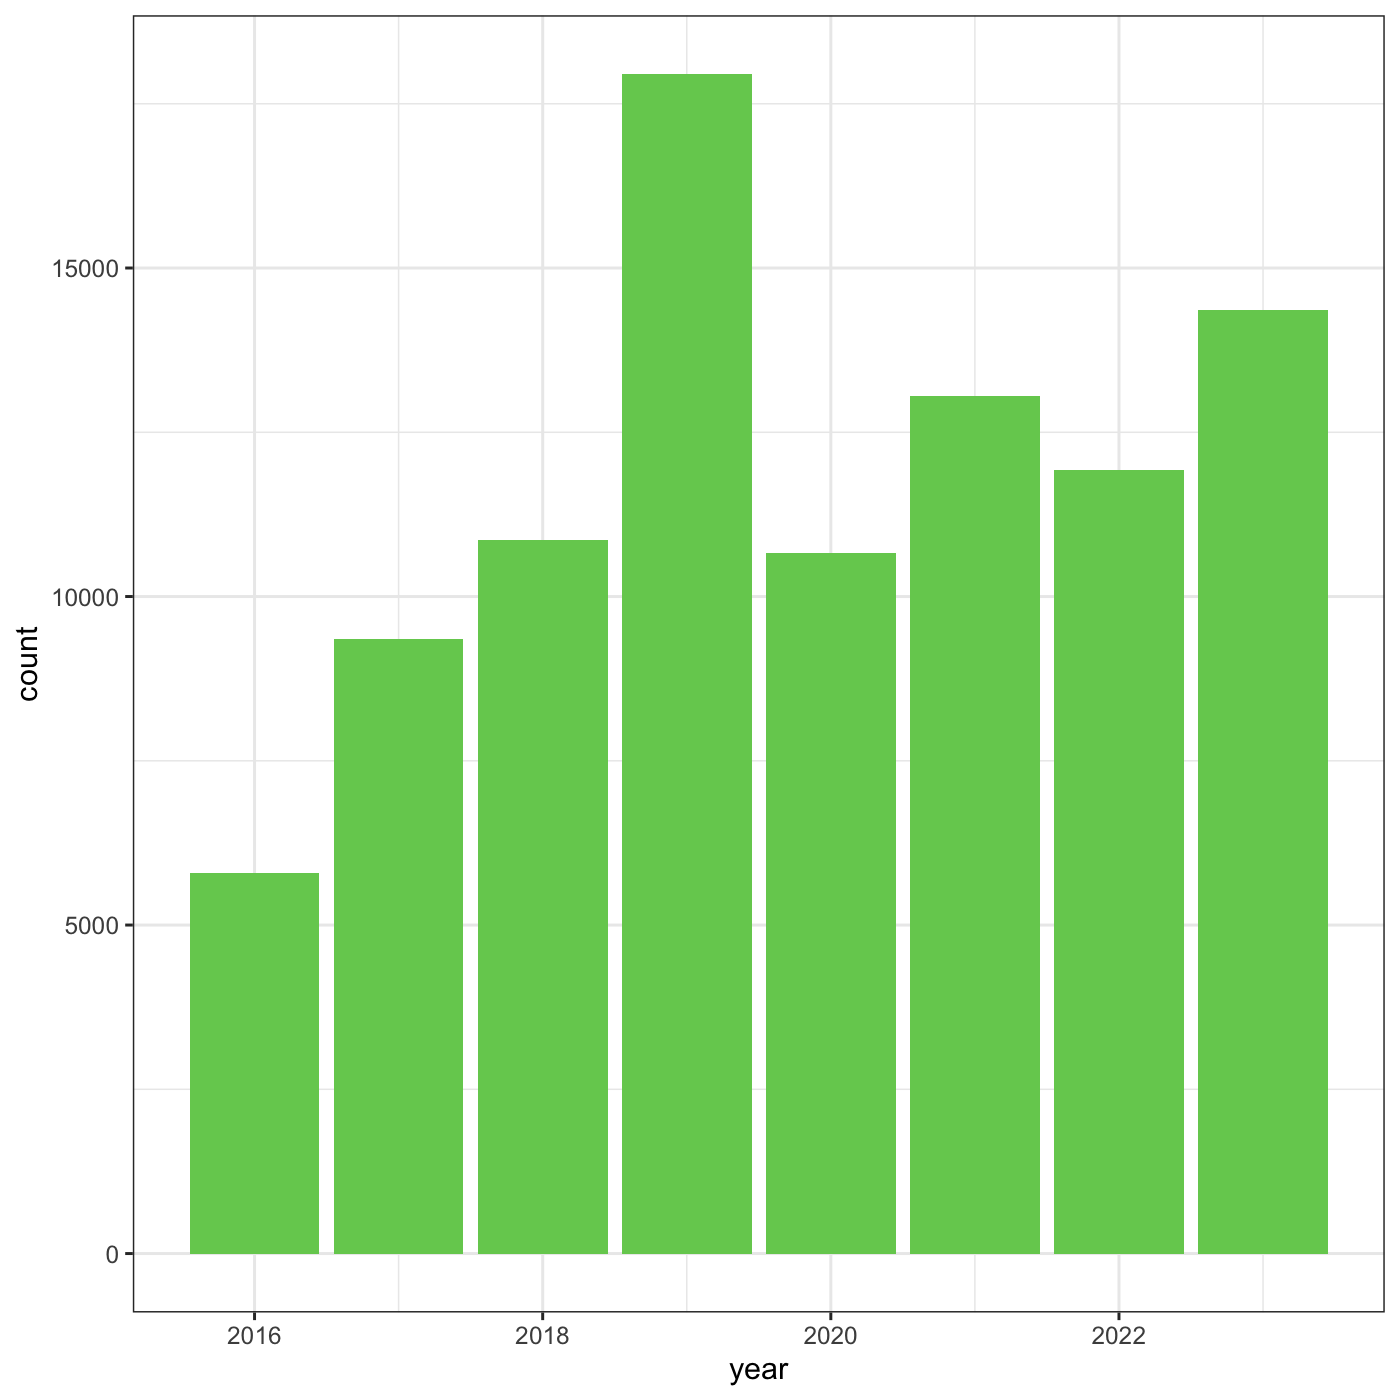
Figure 15
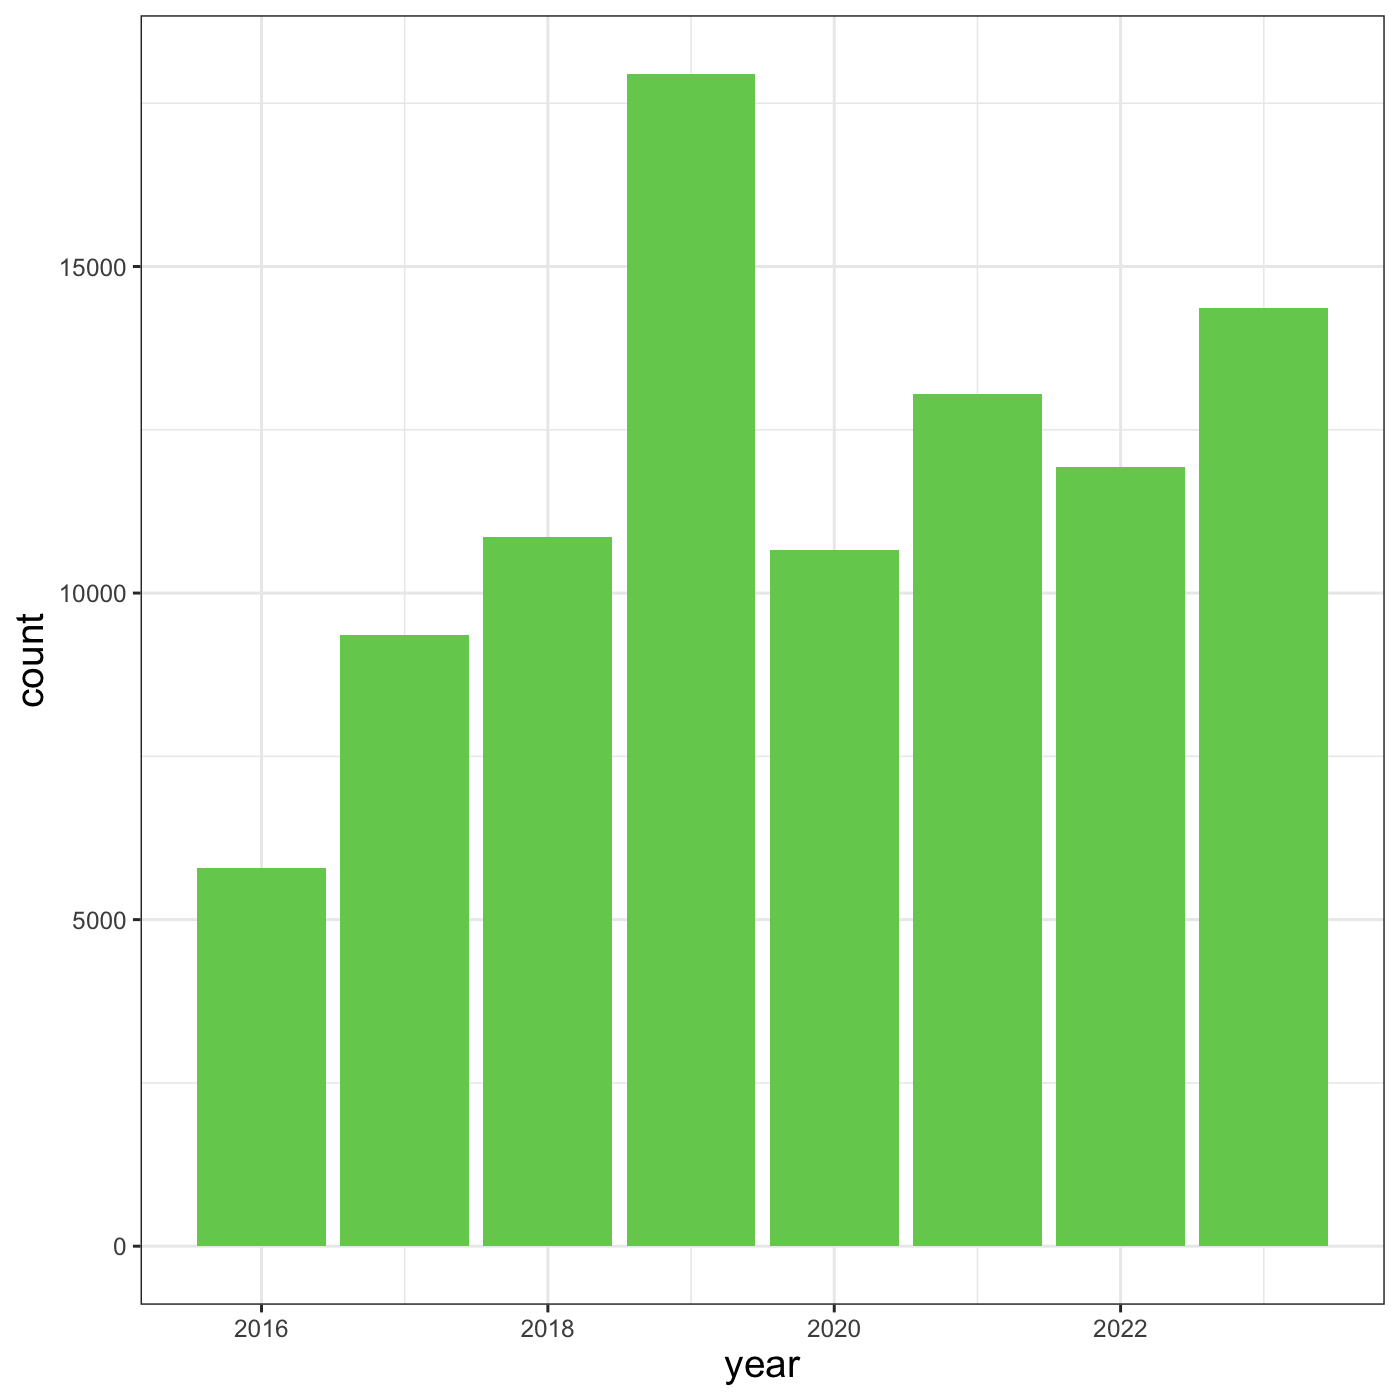
Figure 16
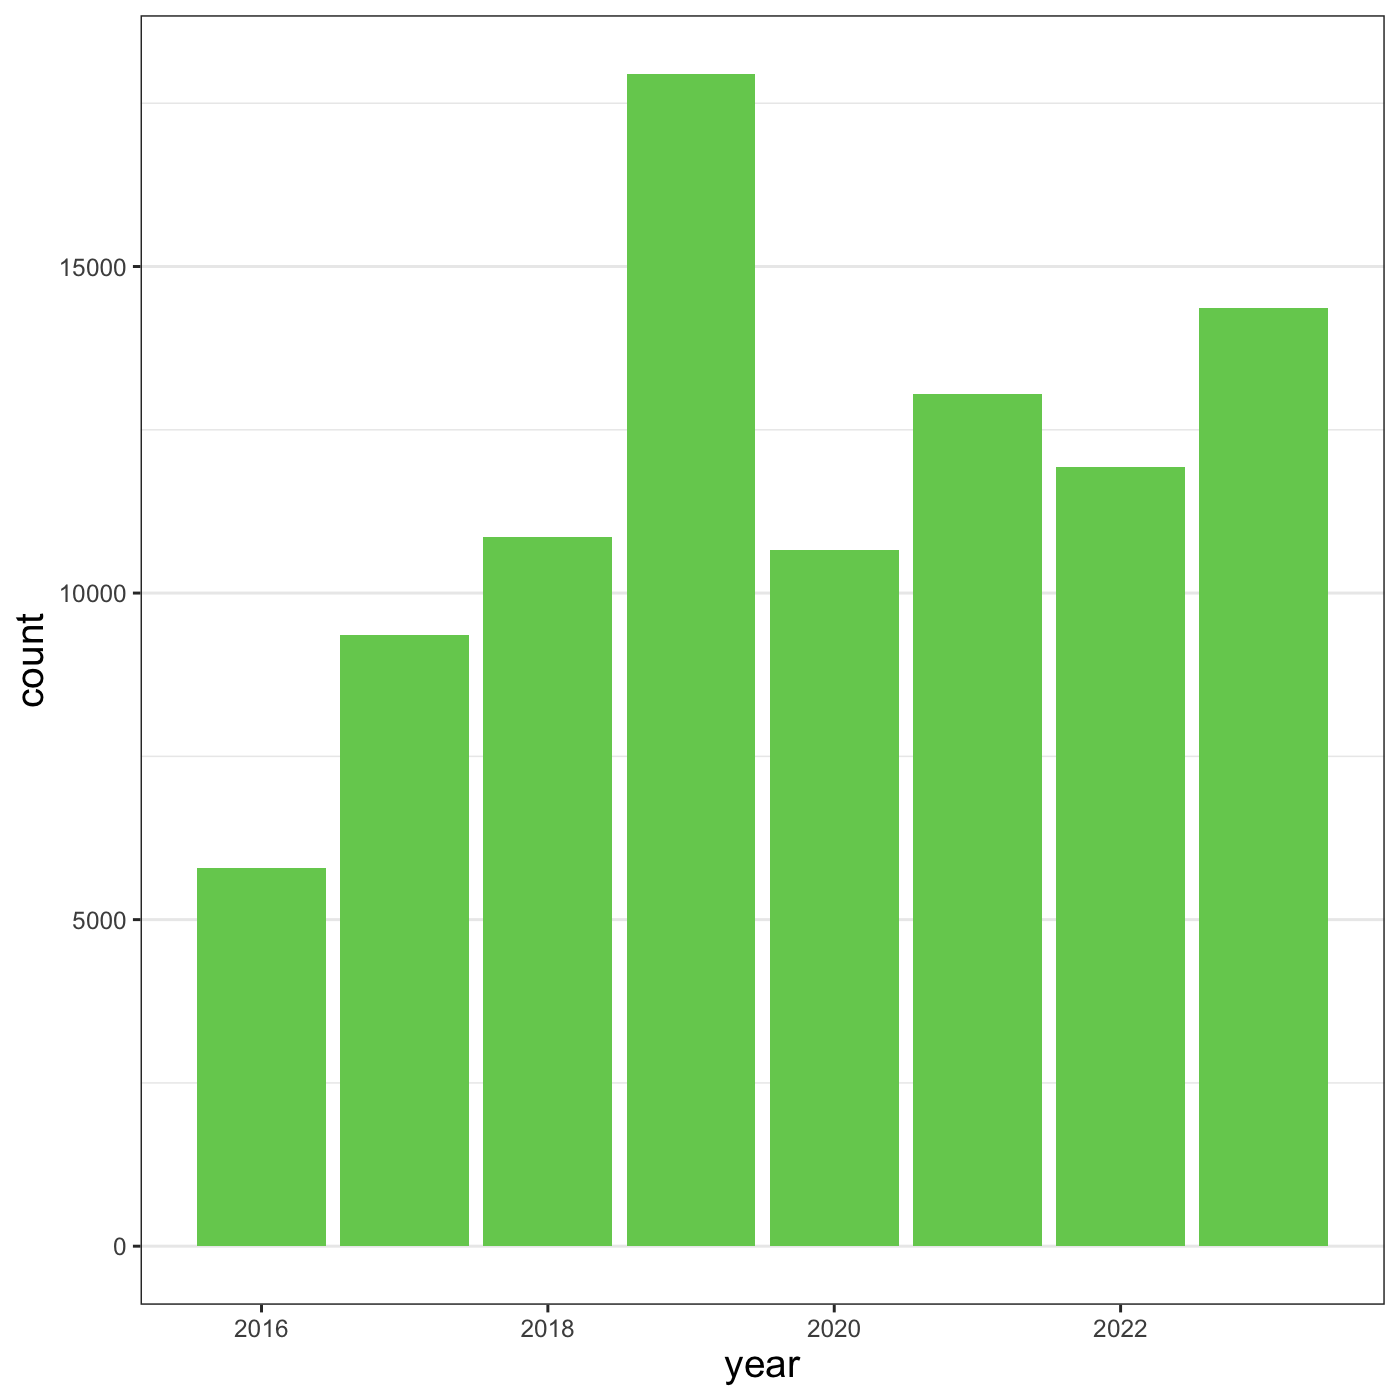
Figure 17
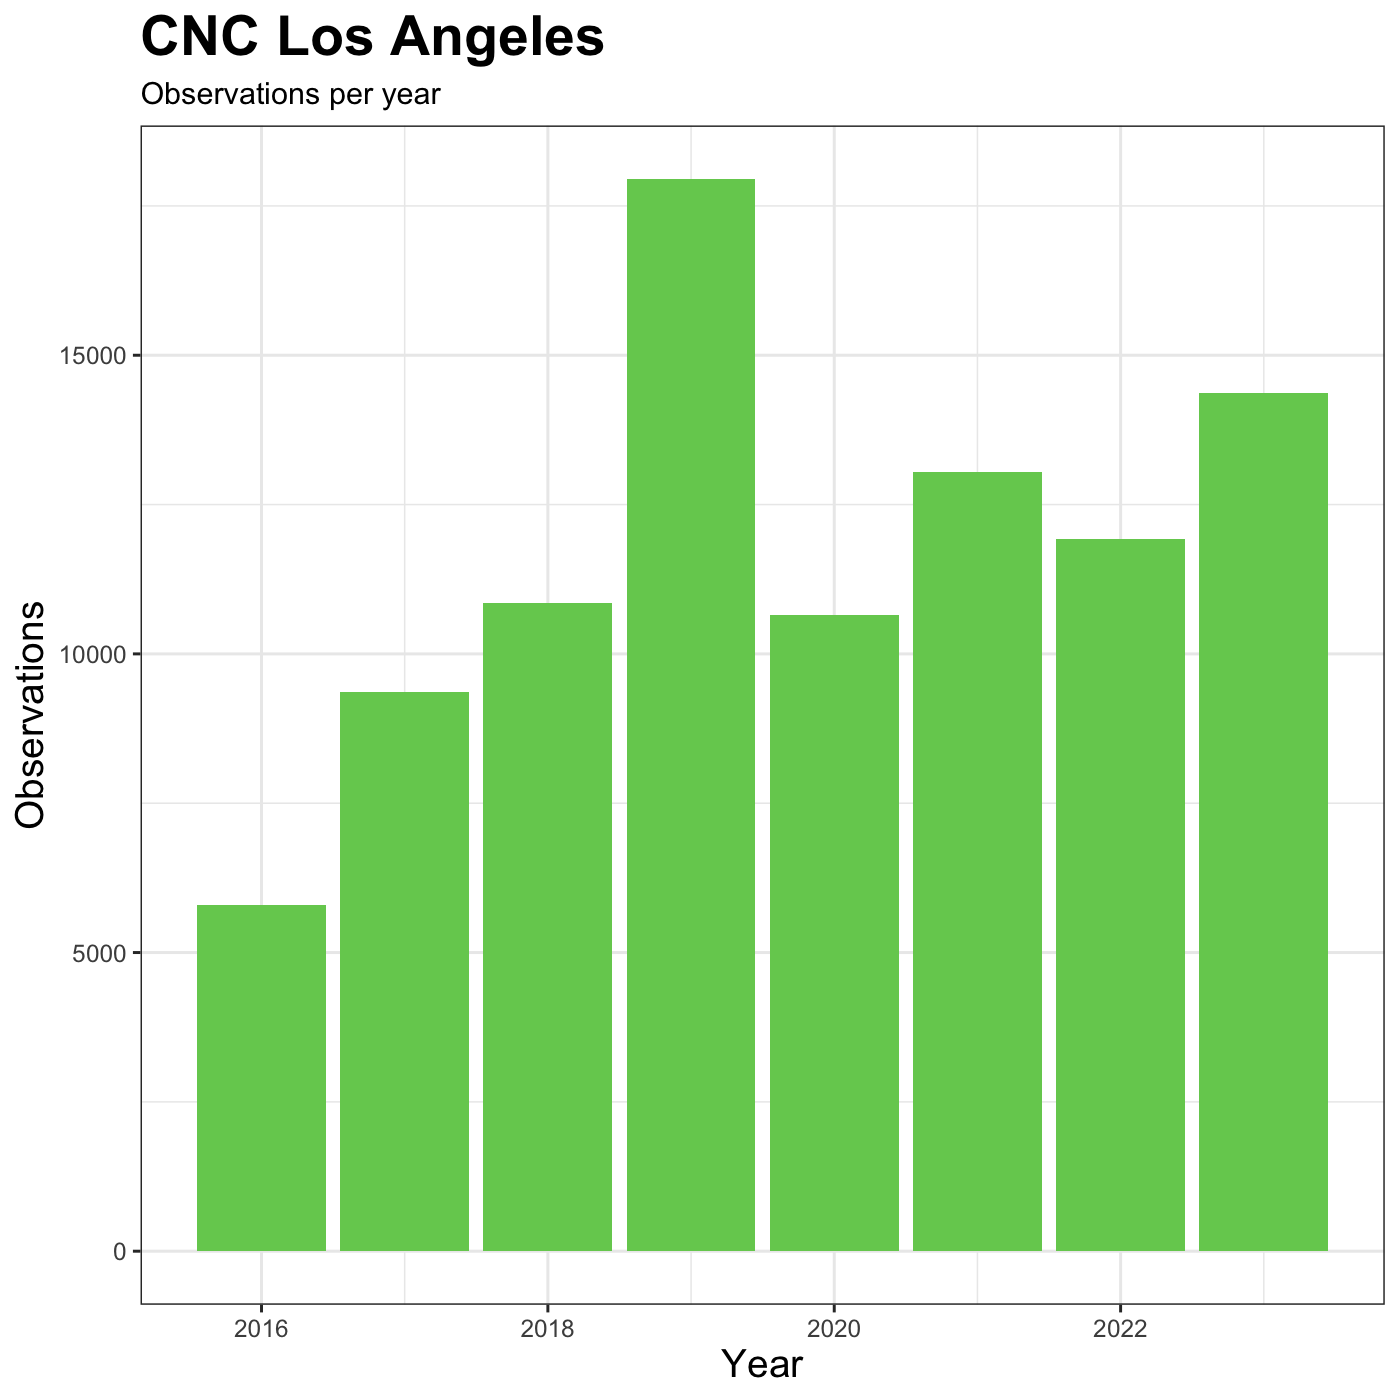
Figure 18
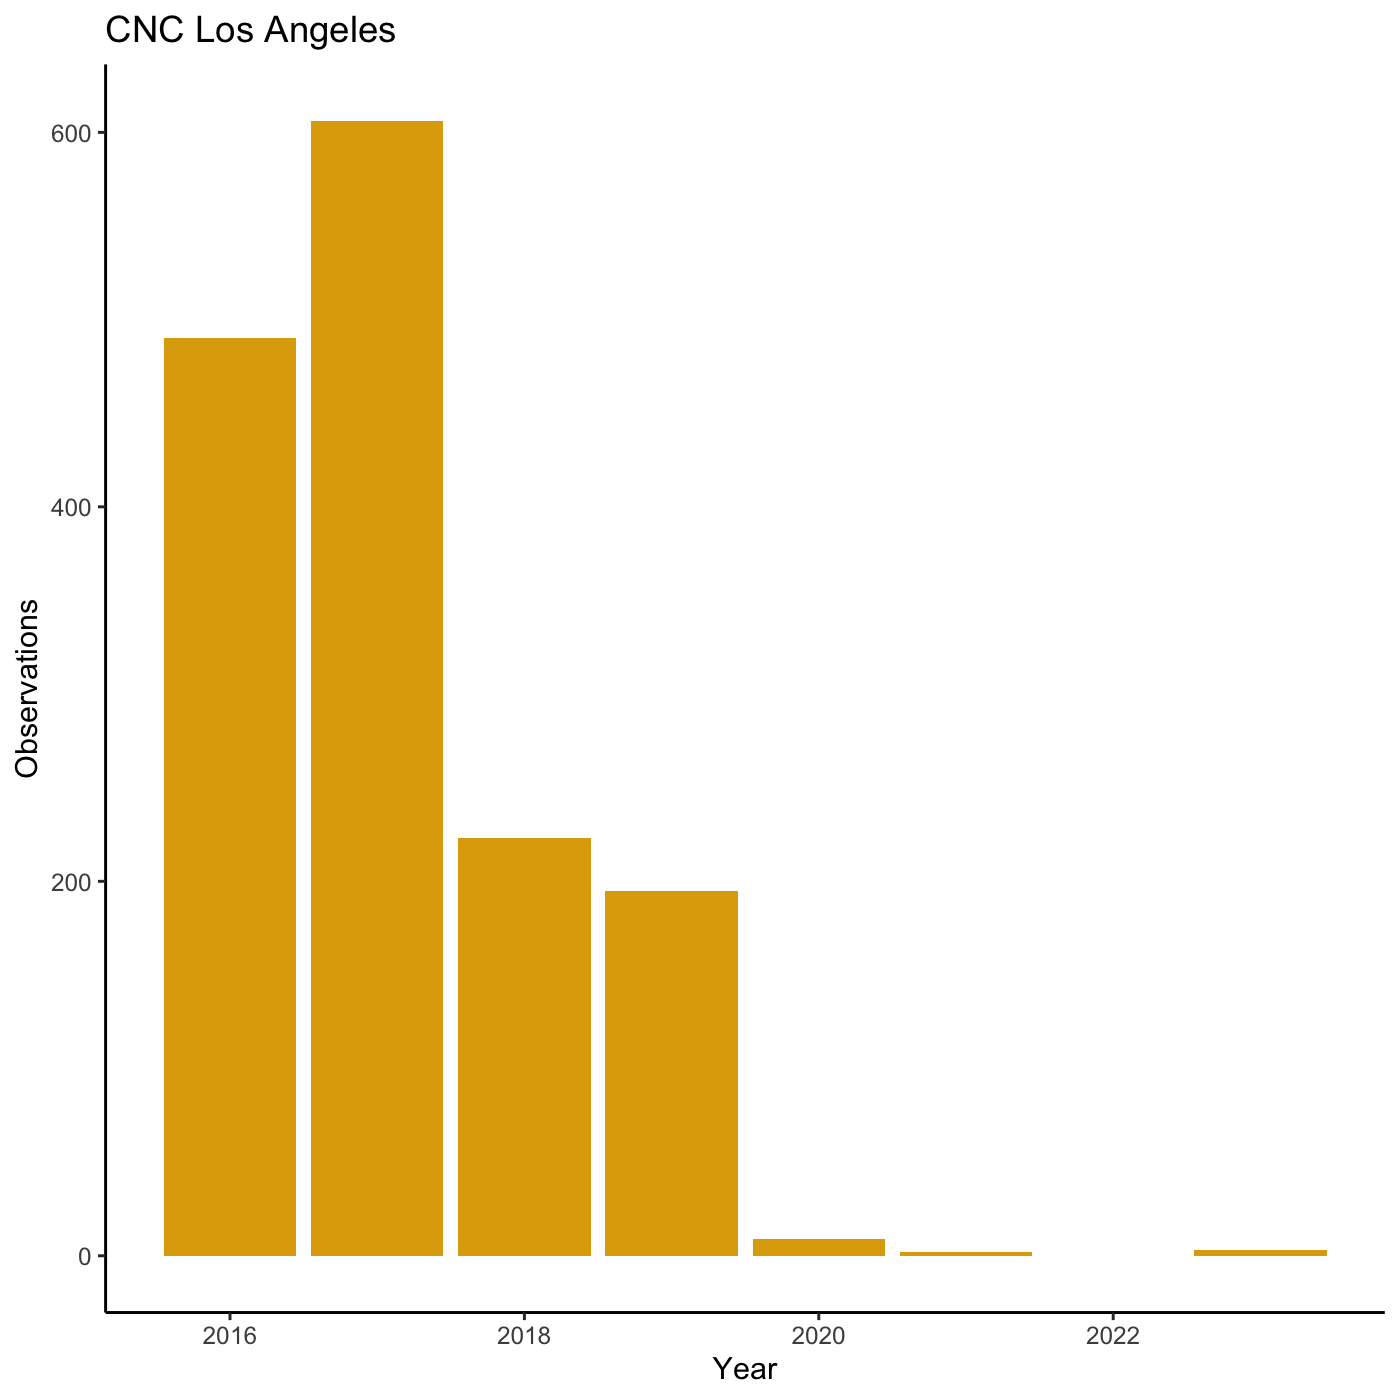
Creating maps
Figure 1
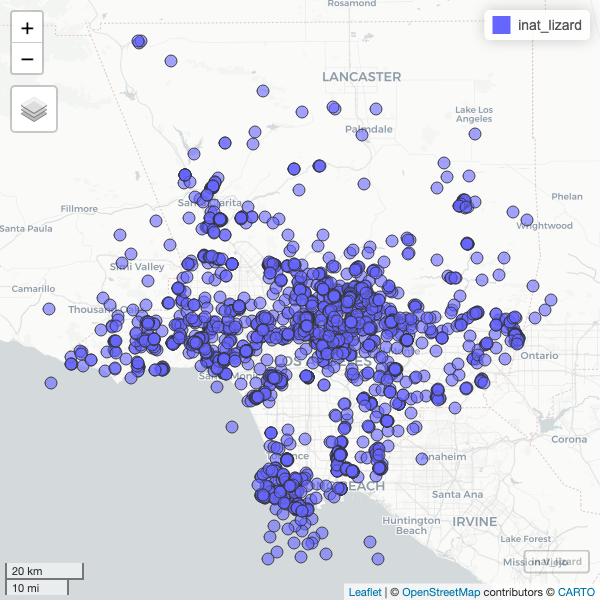
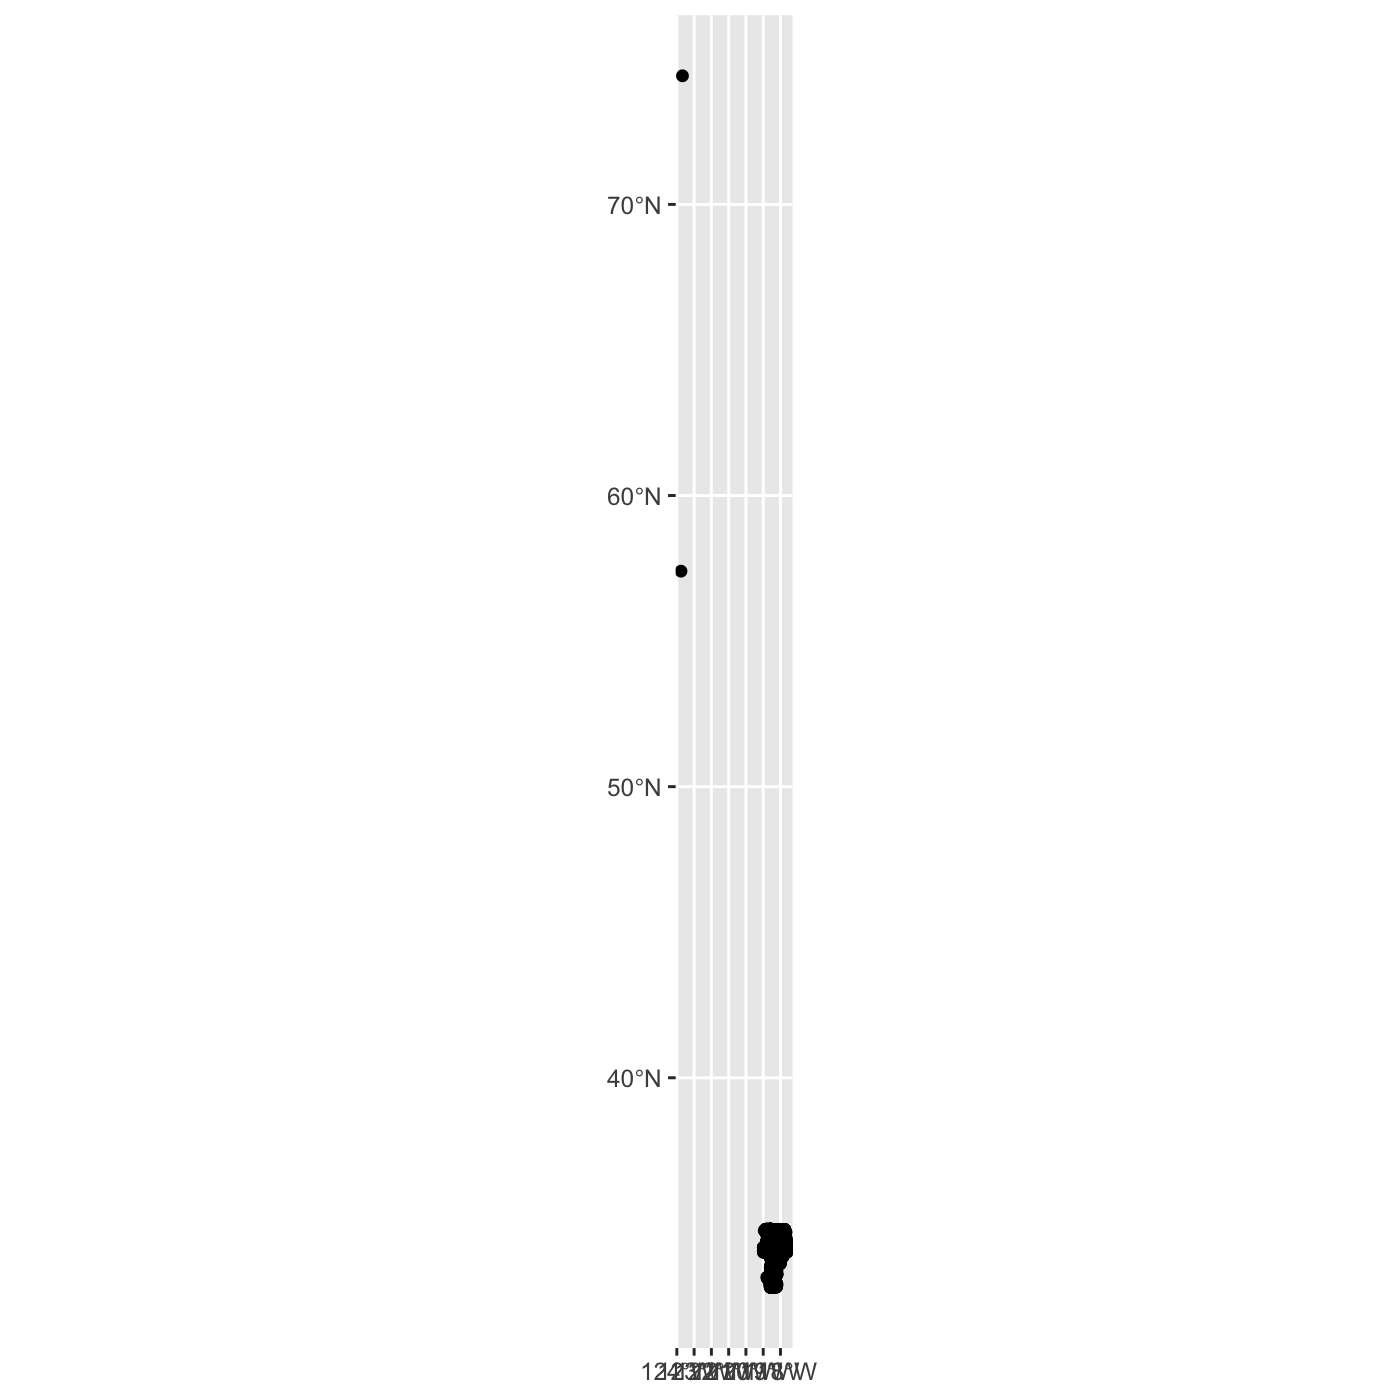 There are some observations that are outside of Los Angeles. Use filter
to select observations in LA.
Figure 2
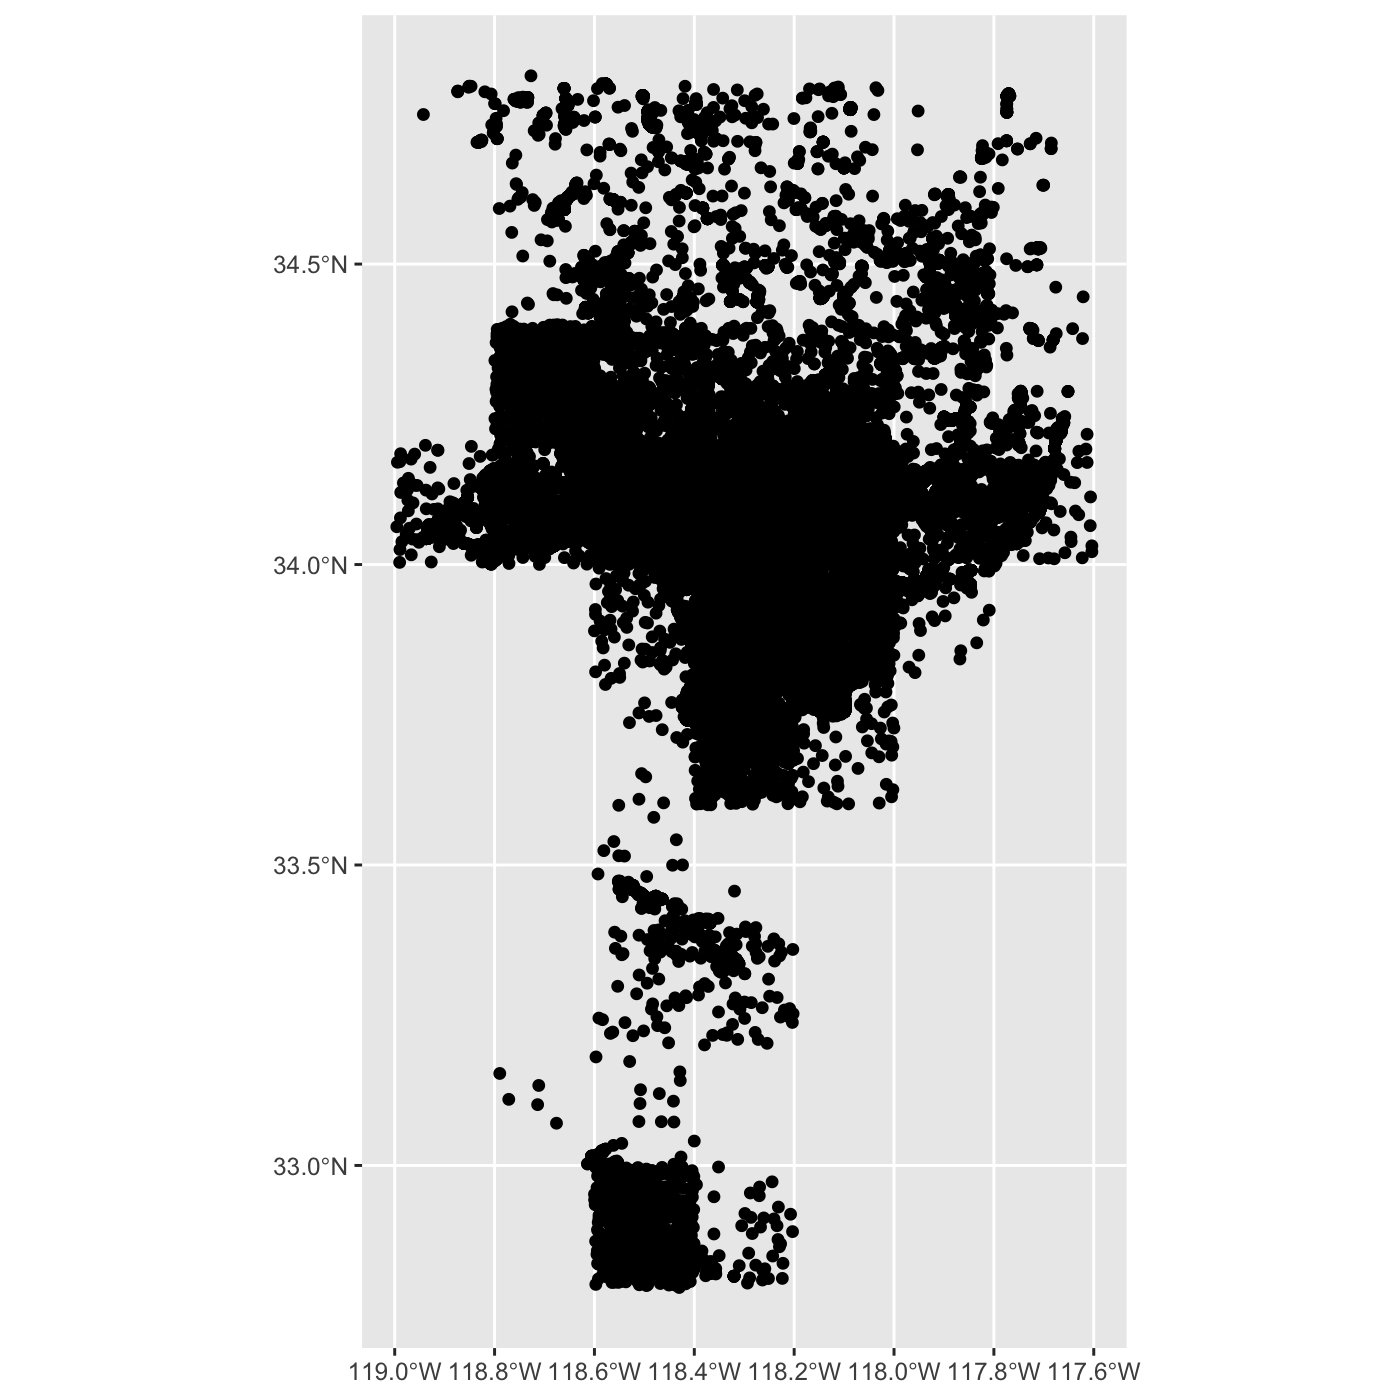
Figure 3
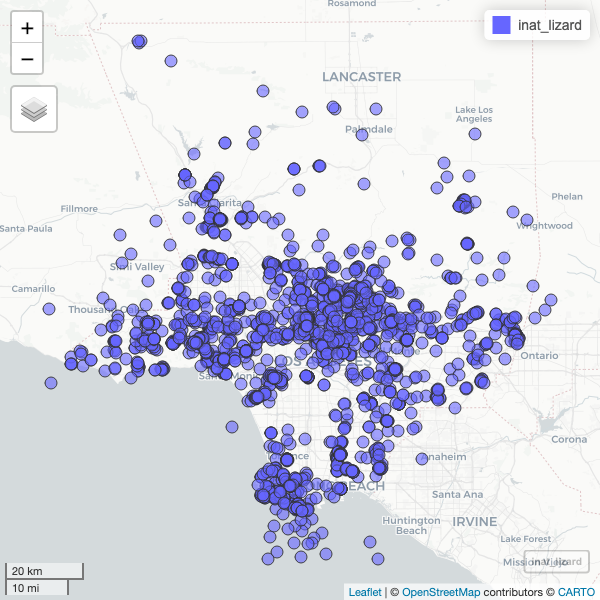
Figure 4
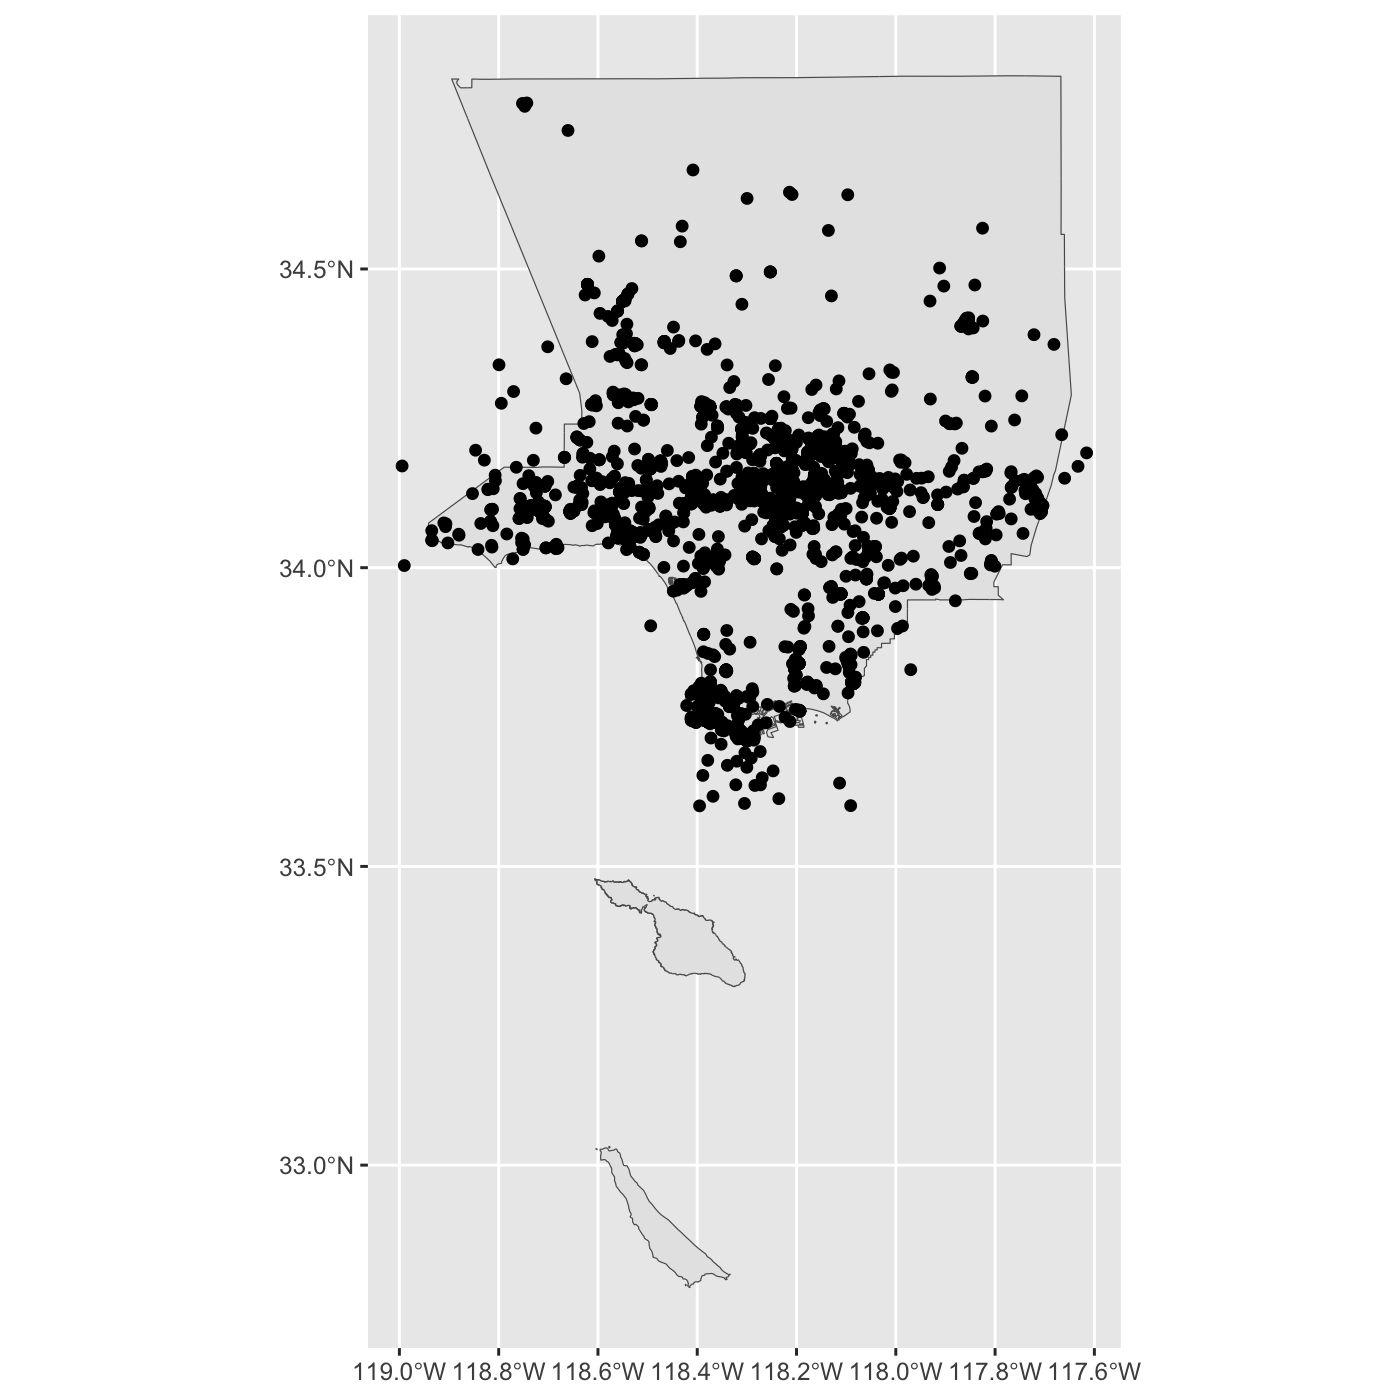
Figure 5
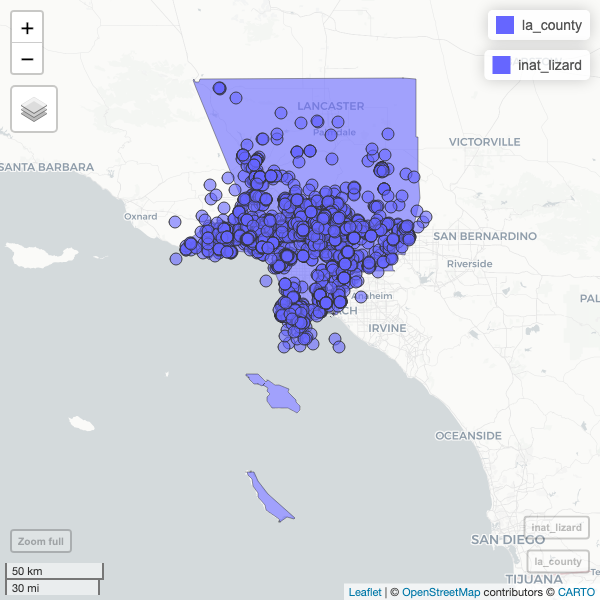
Figure 6
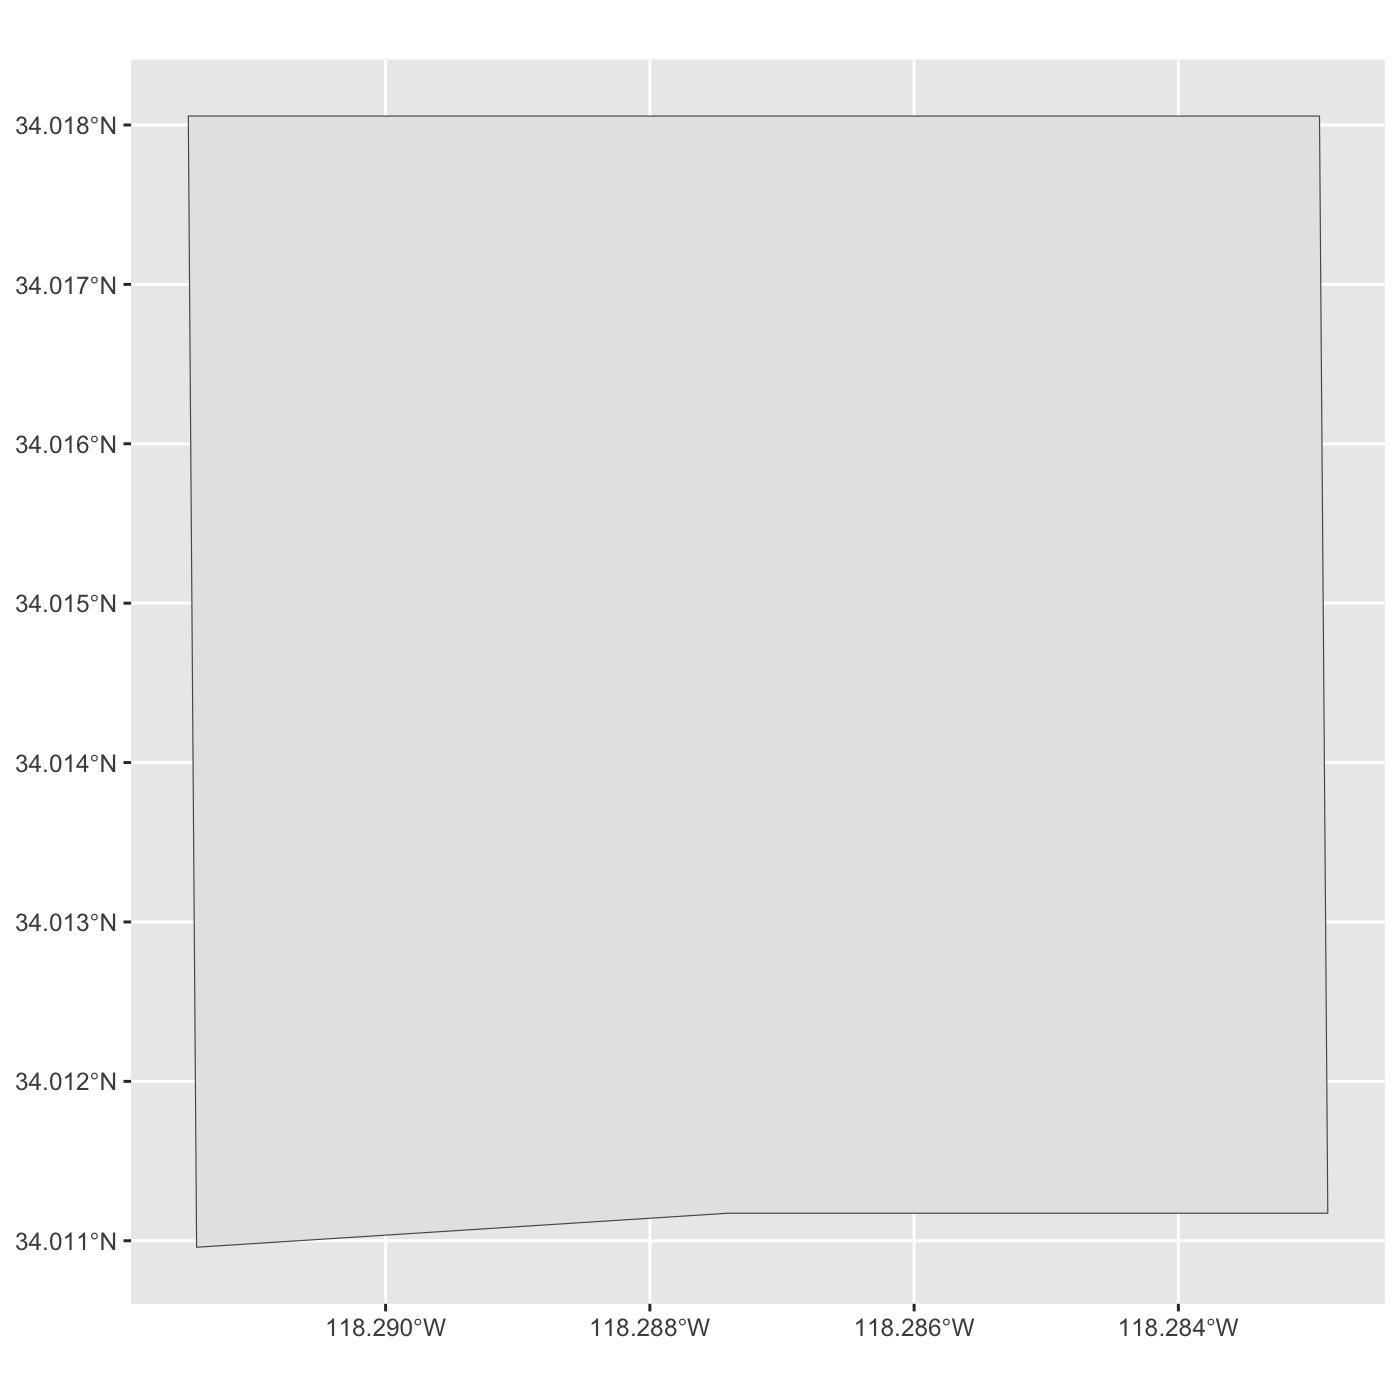
Figure 7
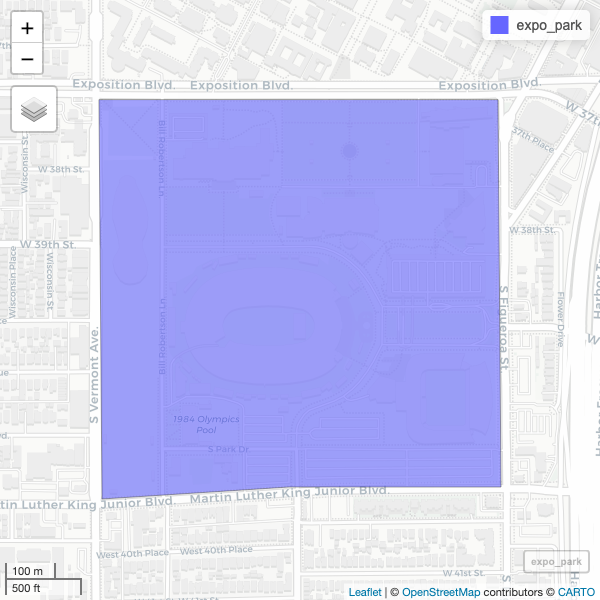
Figure 8
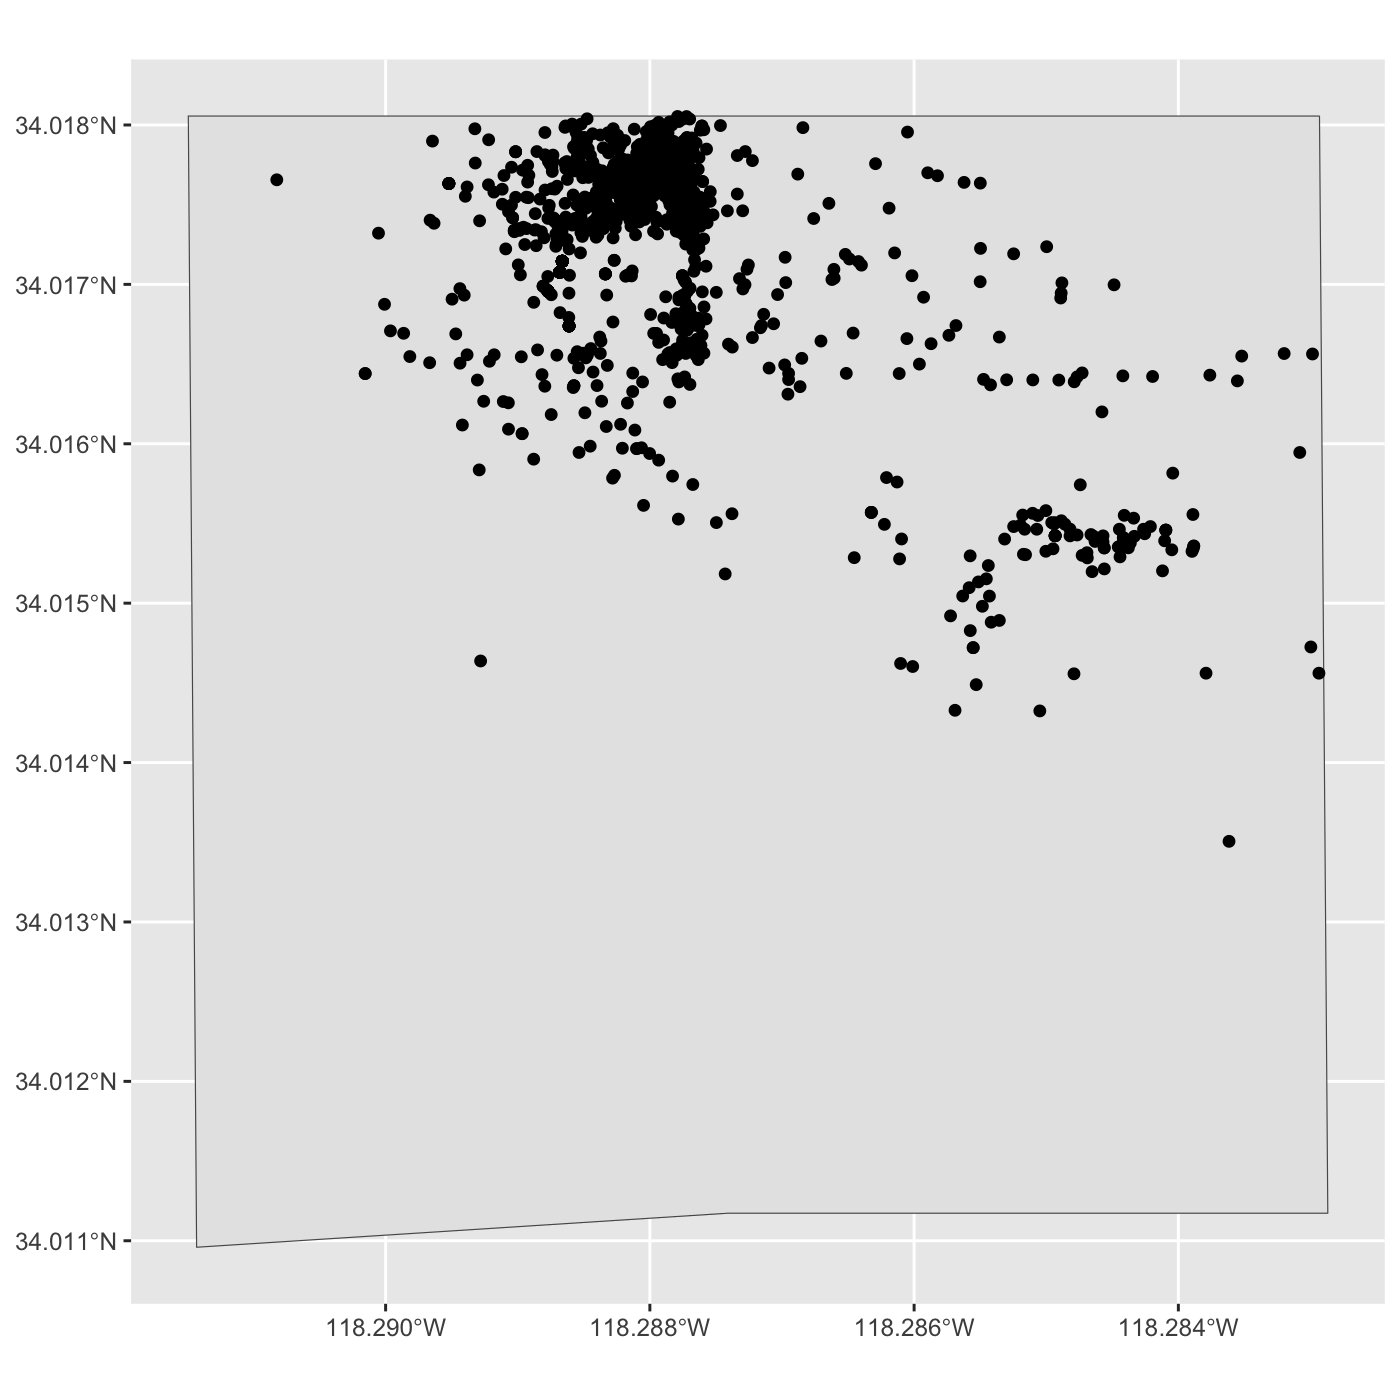
Figure 9
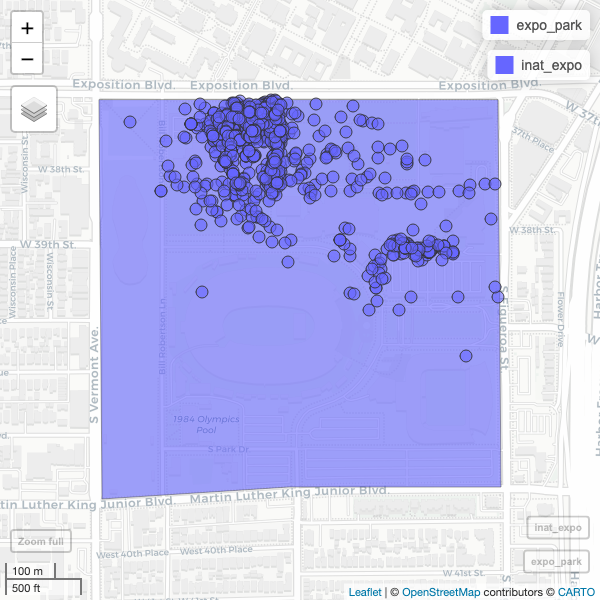
Figure 10
