Intro to Data AnalysisiNaturalist dataInstructions to download iNaturalist dataAnalyzing dataExample of analyzing iNaturalist data using R
Figure 1
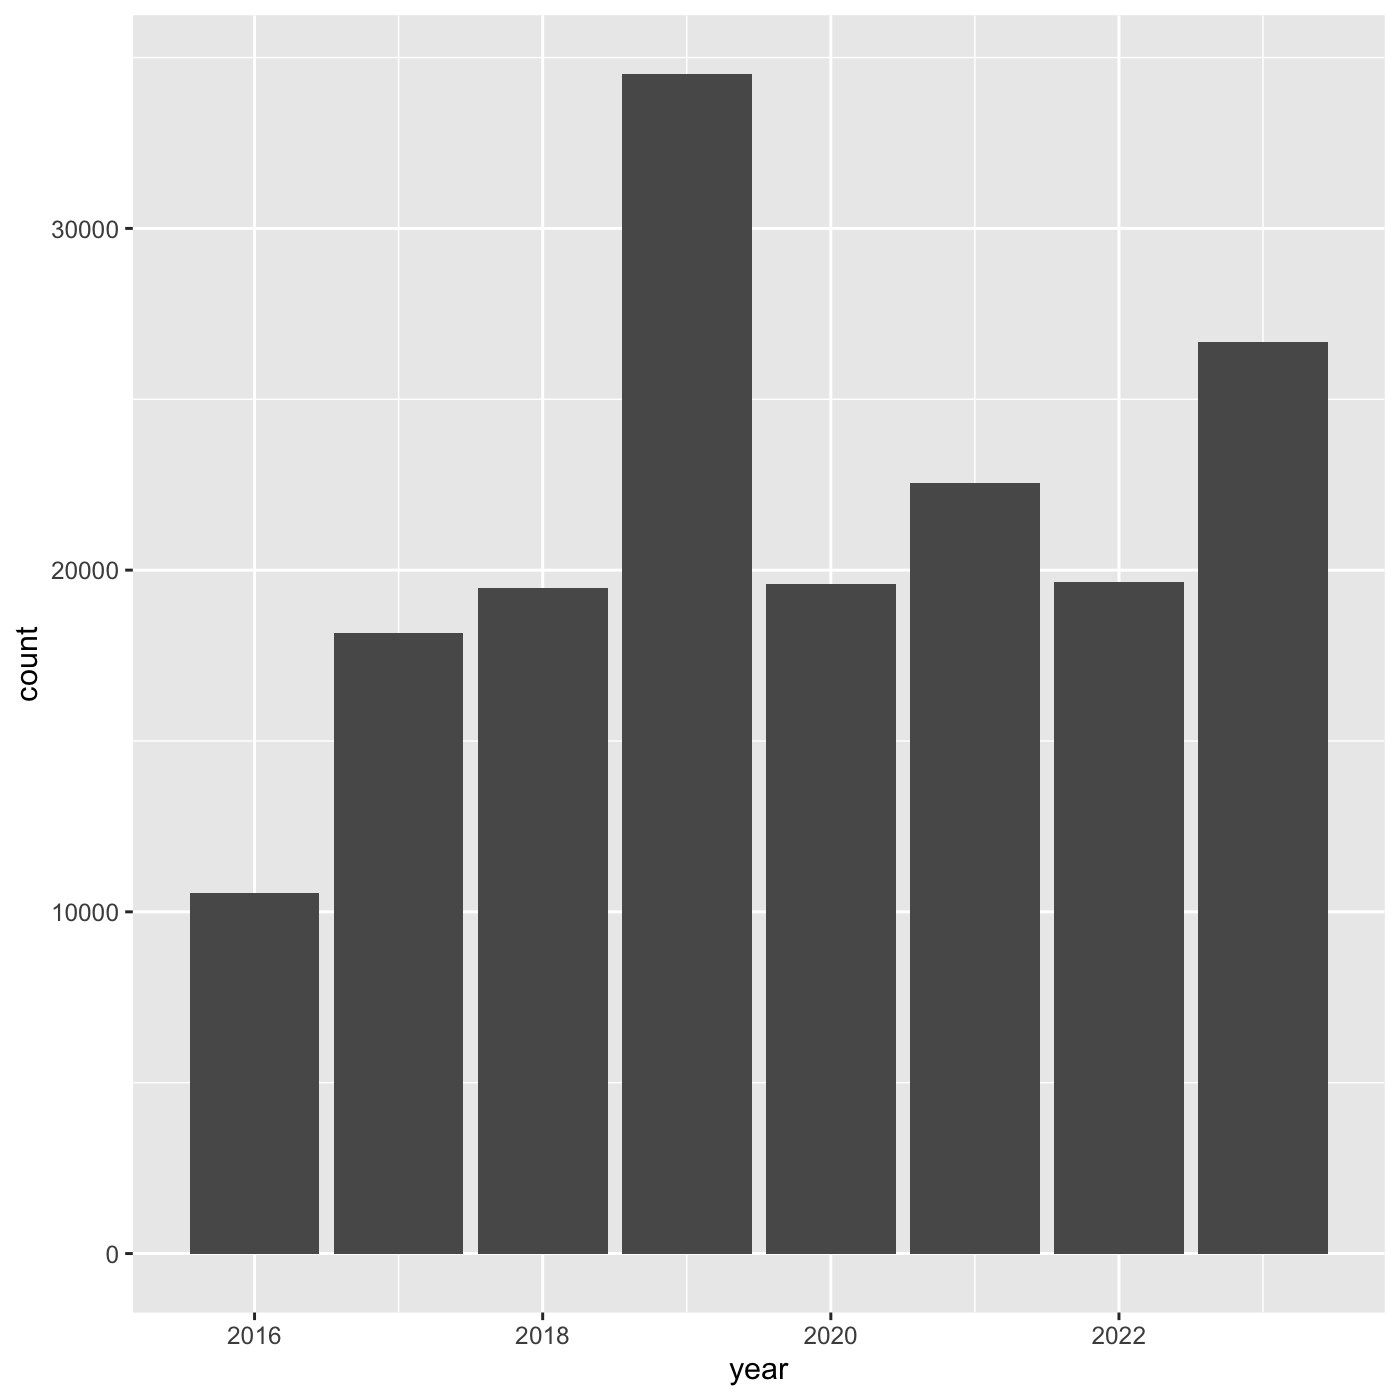
Figure 2

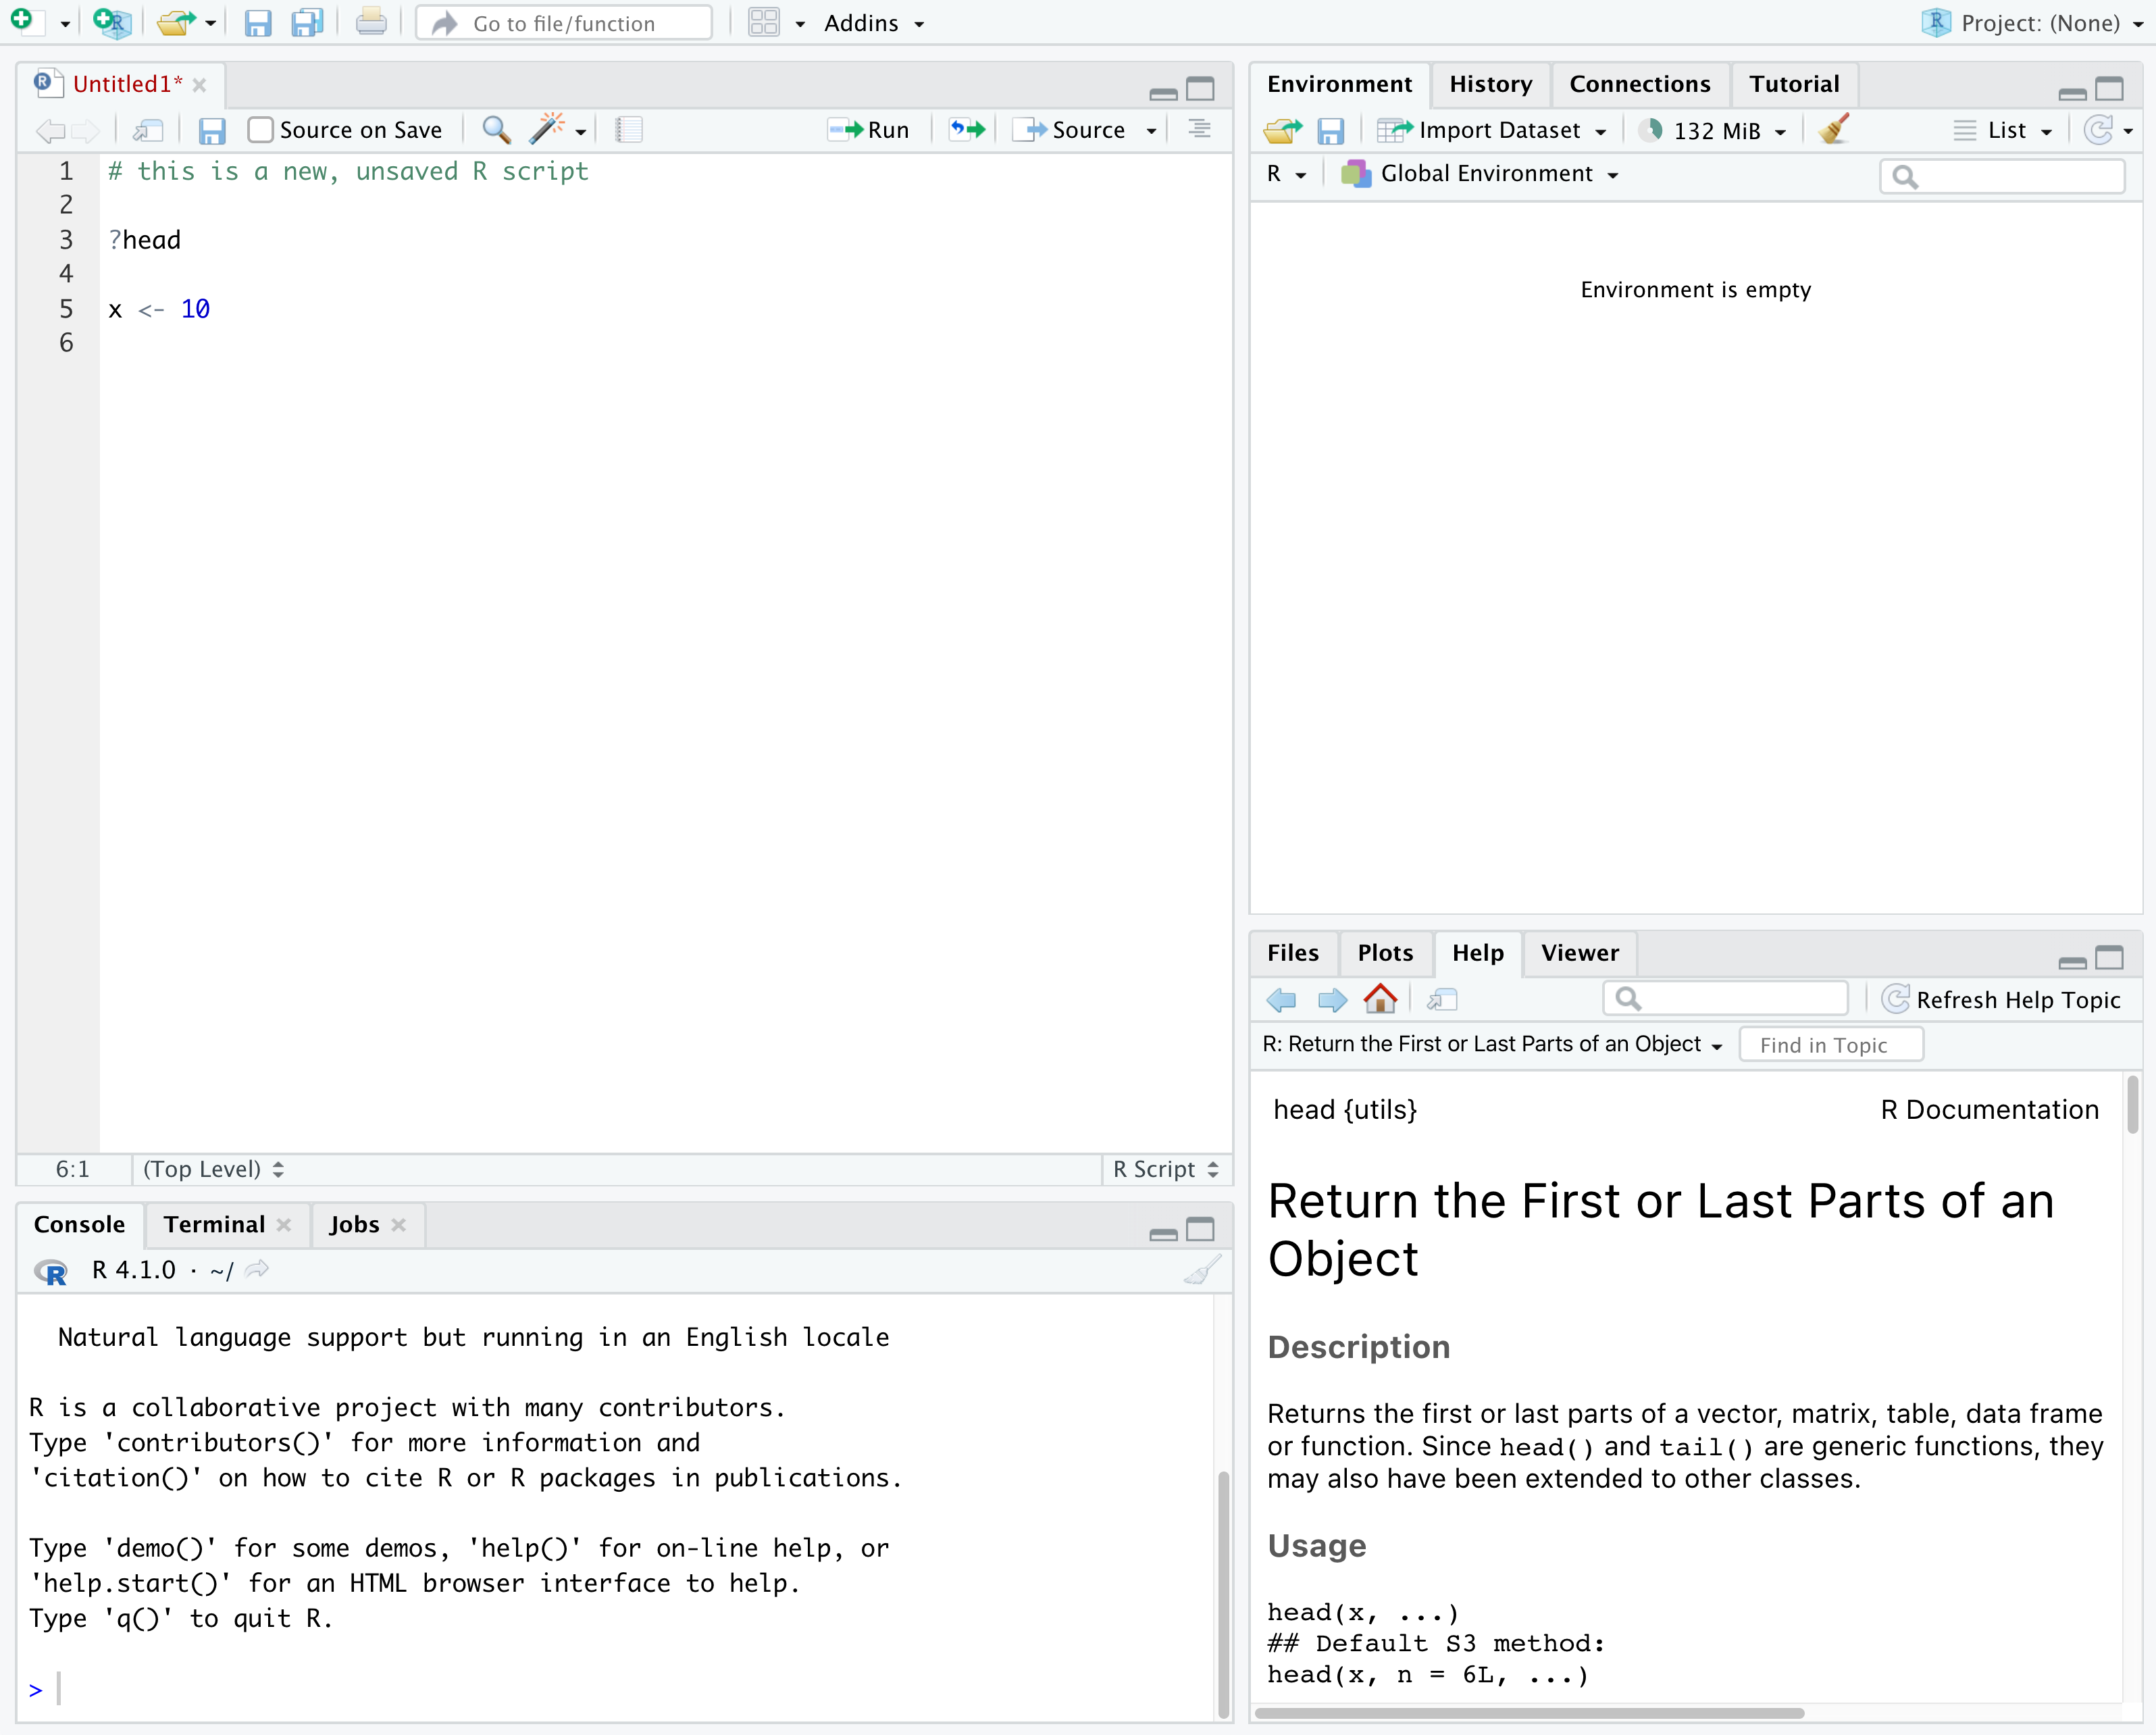
Introduction to R and RStudioGetting set up in RStudio
Figure 1
Exploring and understanding data
Working with data
Data visualization with ggplot2
Figure 1

Figure 2
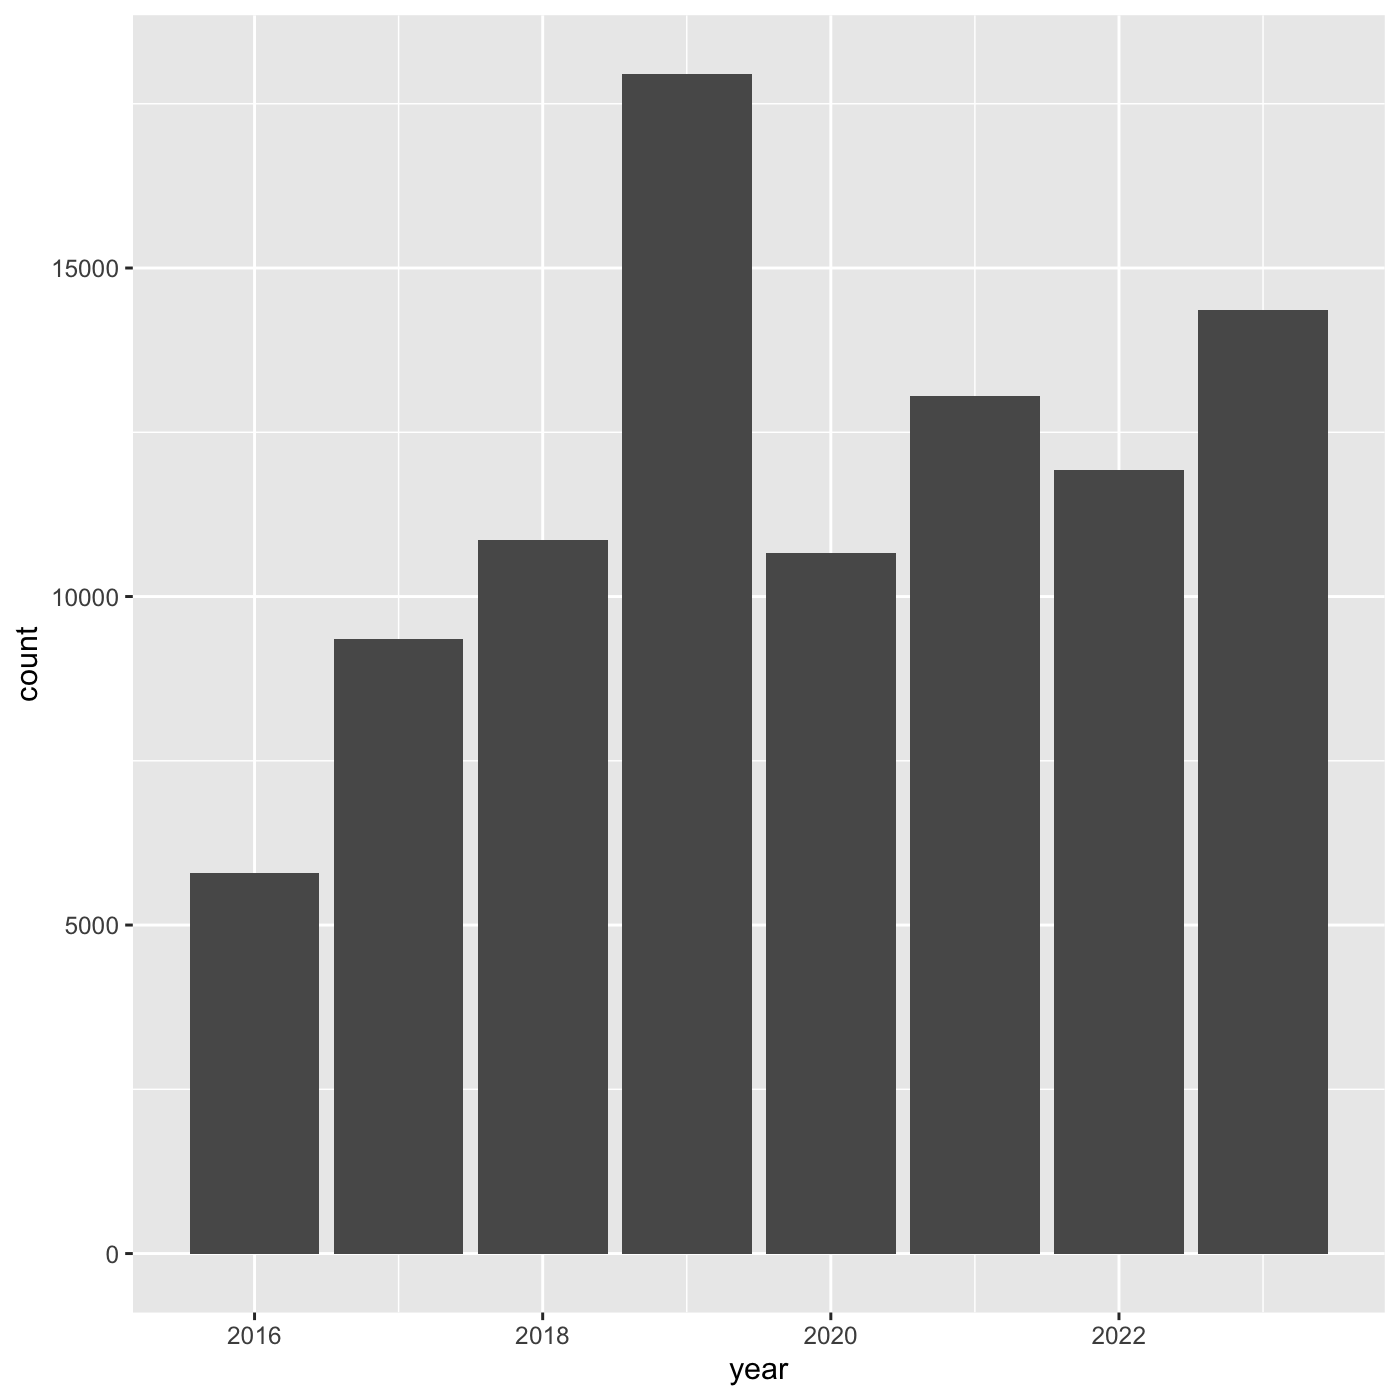
 Next we need to specify how we want the data to be displayed. We do this
using
Next we need to specify how we want the data to be displayed. We do this
using geom_ functions, which specify the type of geometry
we want, such as points, lines, or bars. We use geom_bar()
to create a vertical bar plot.
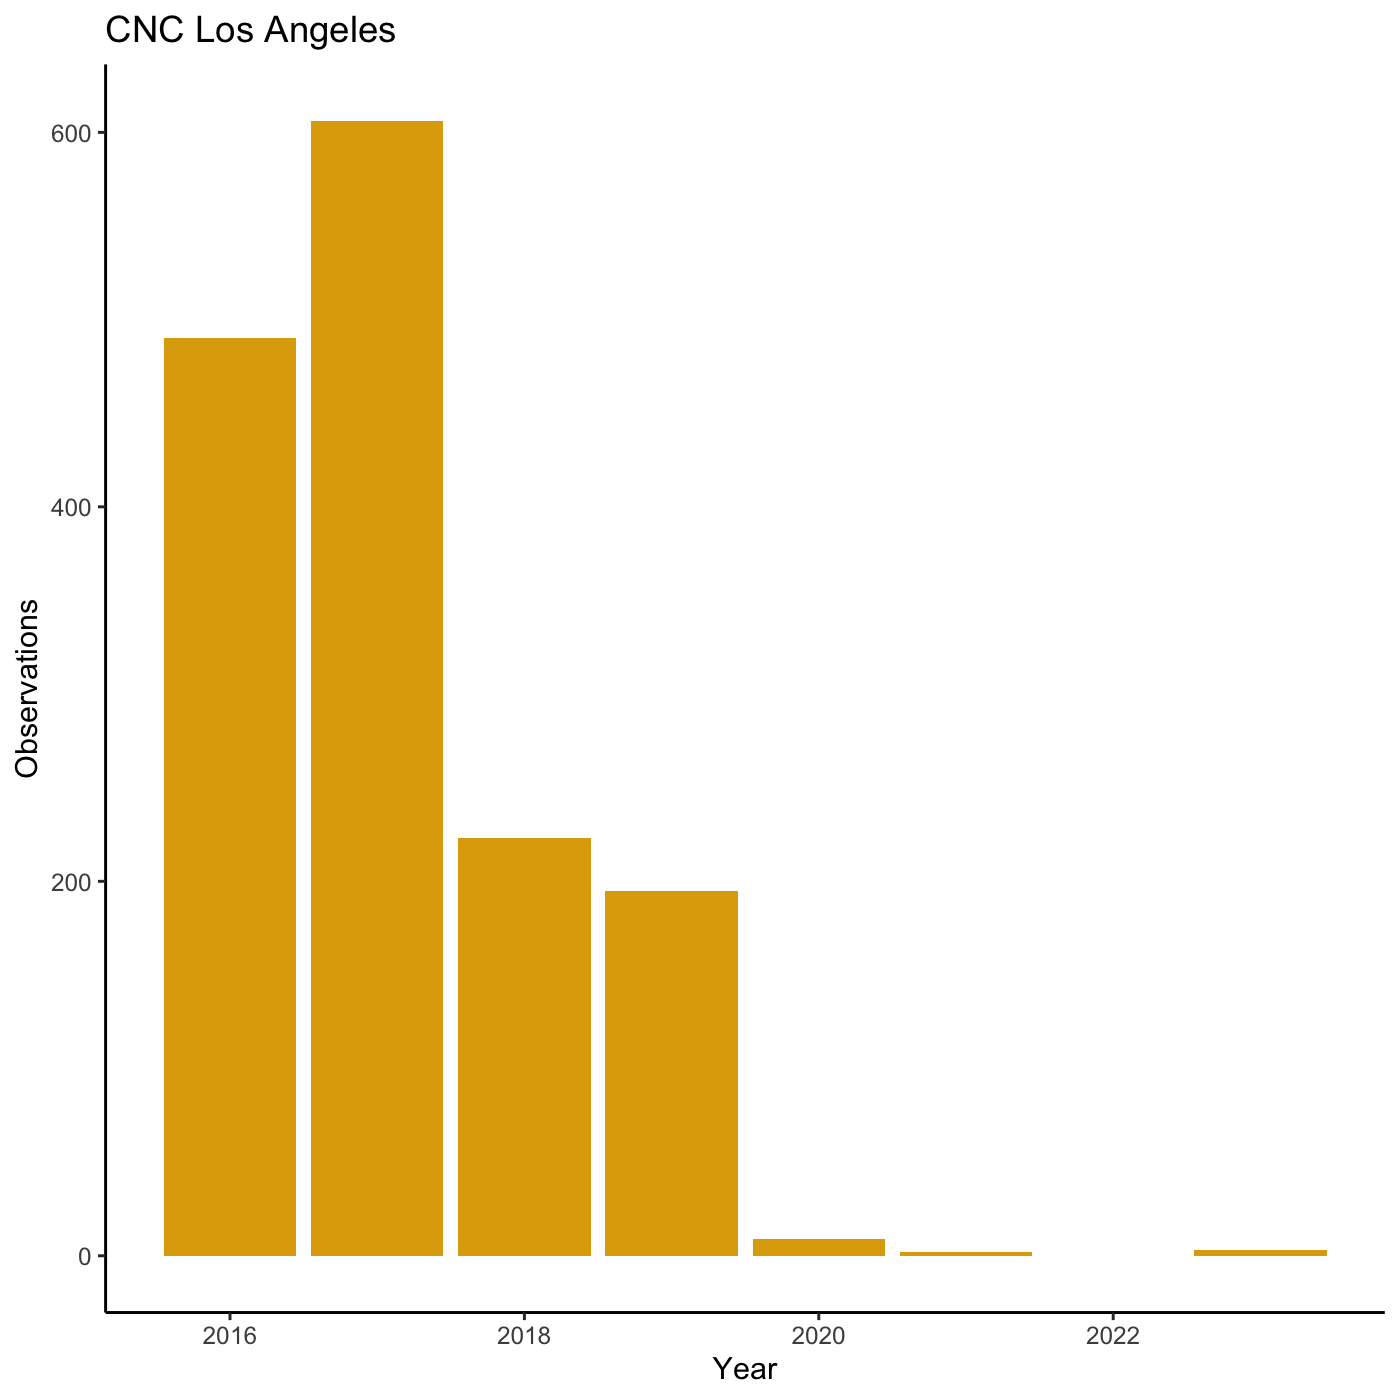
Figure 3
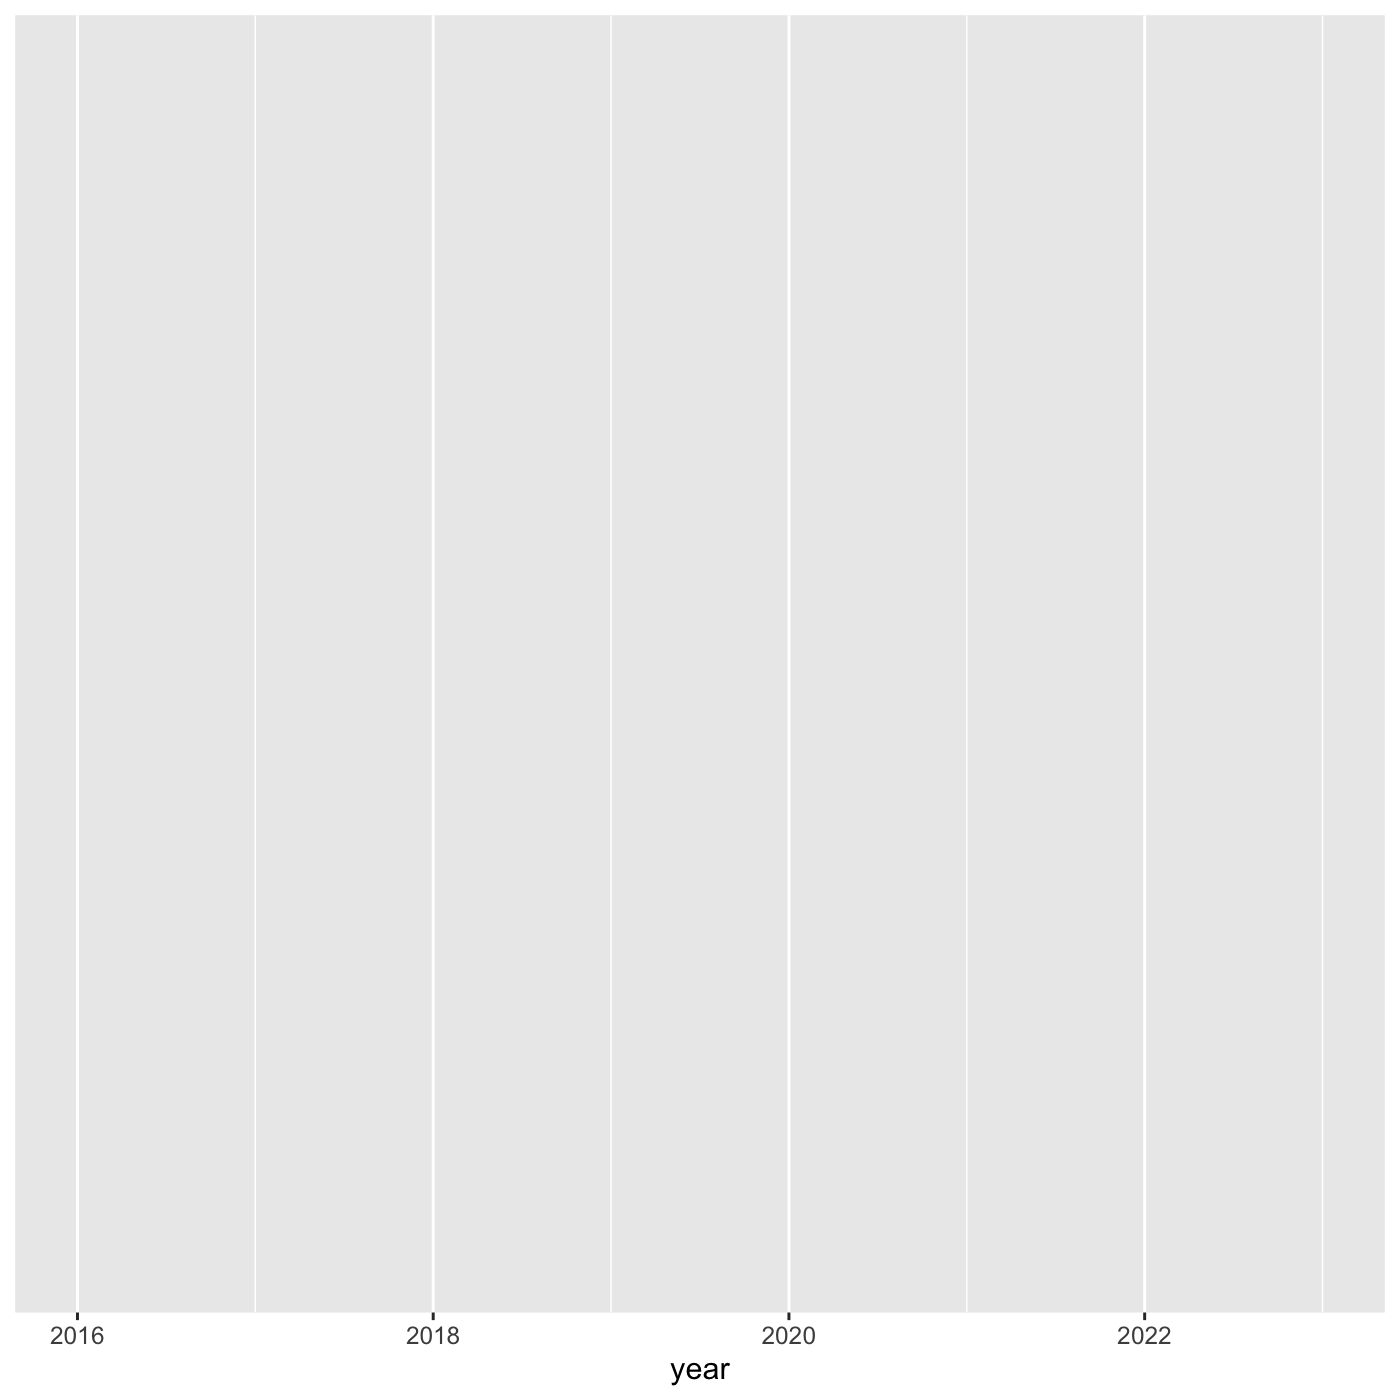
 If we want year on x axis, and count on y axis, use
coord_flip()
Figure 4
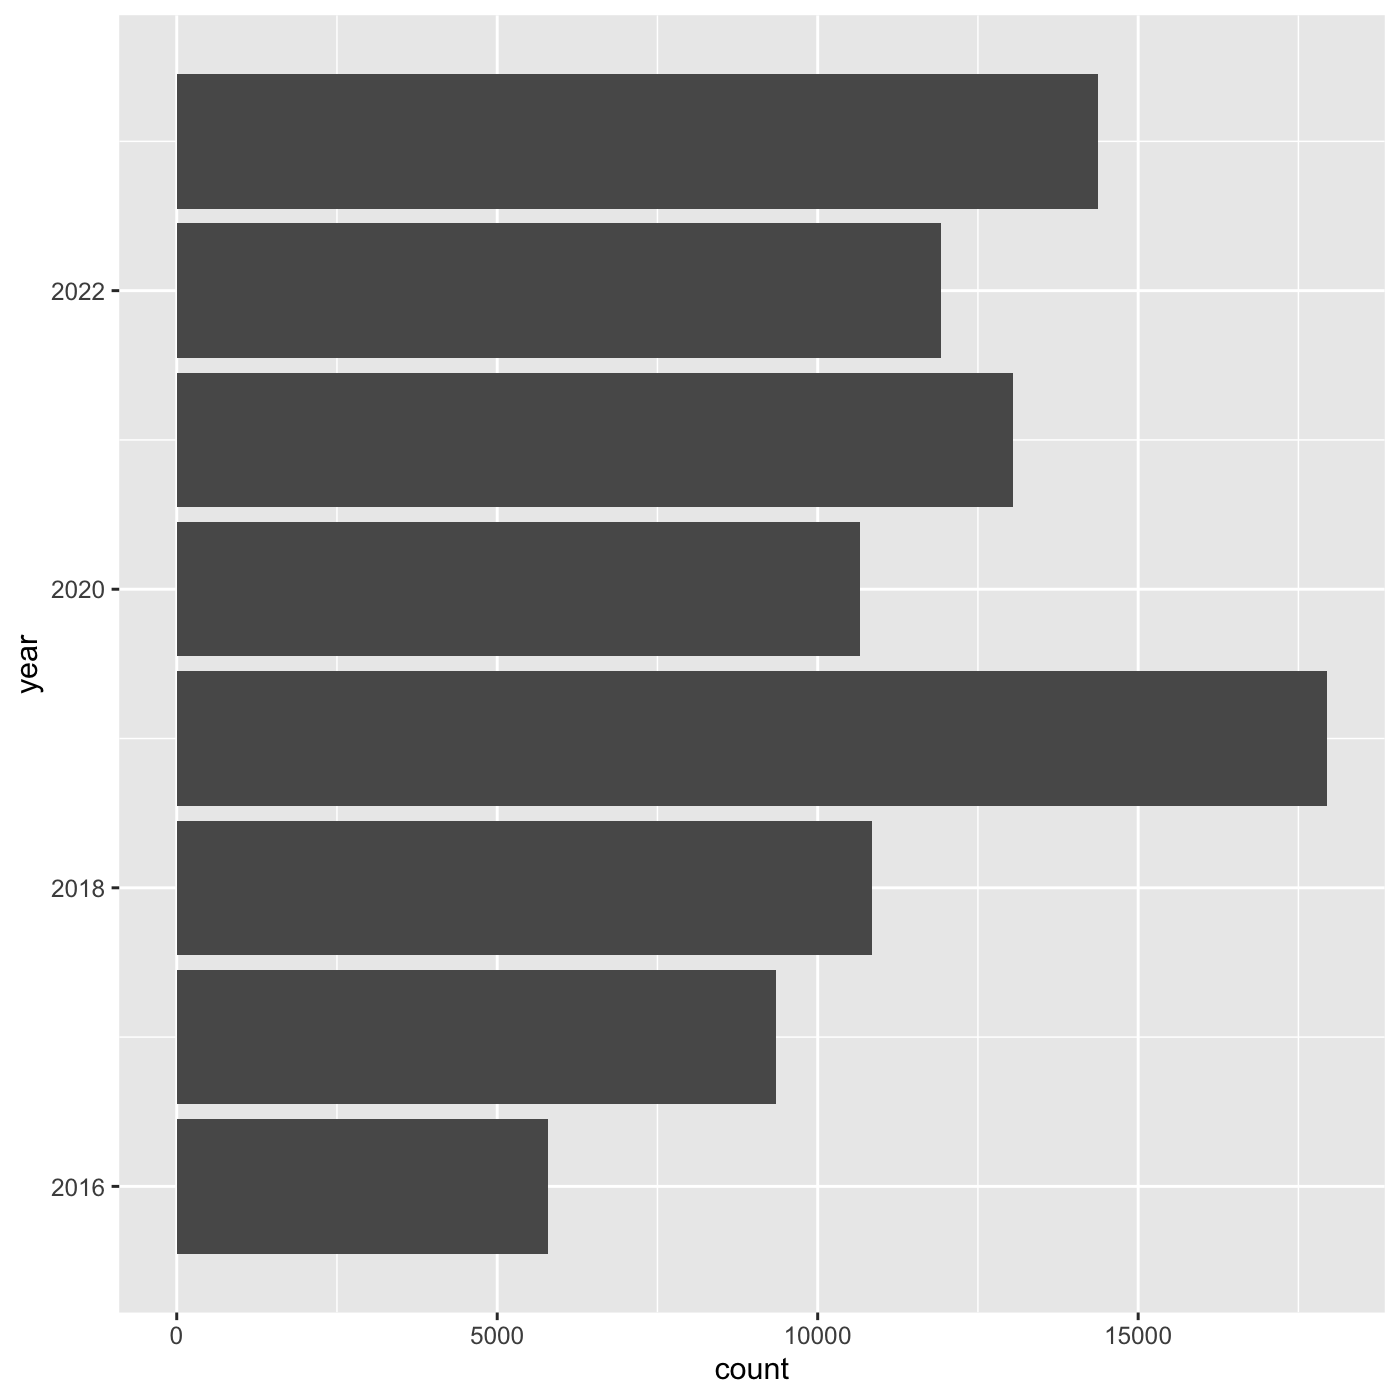
Figure 5
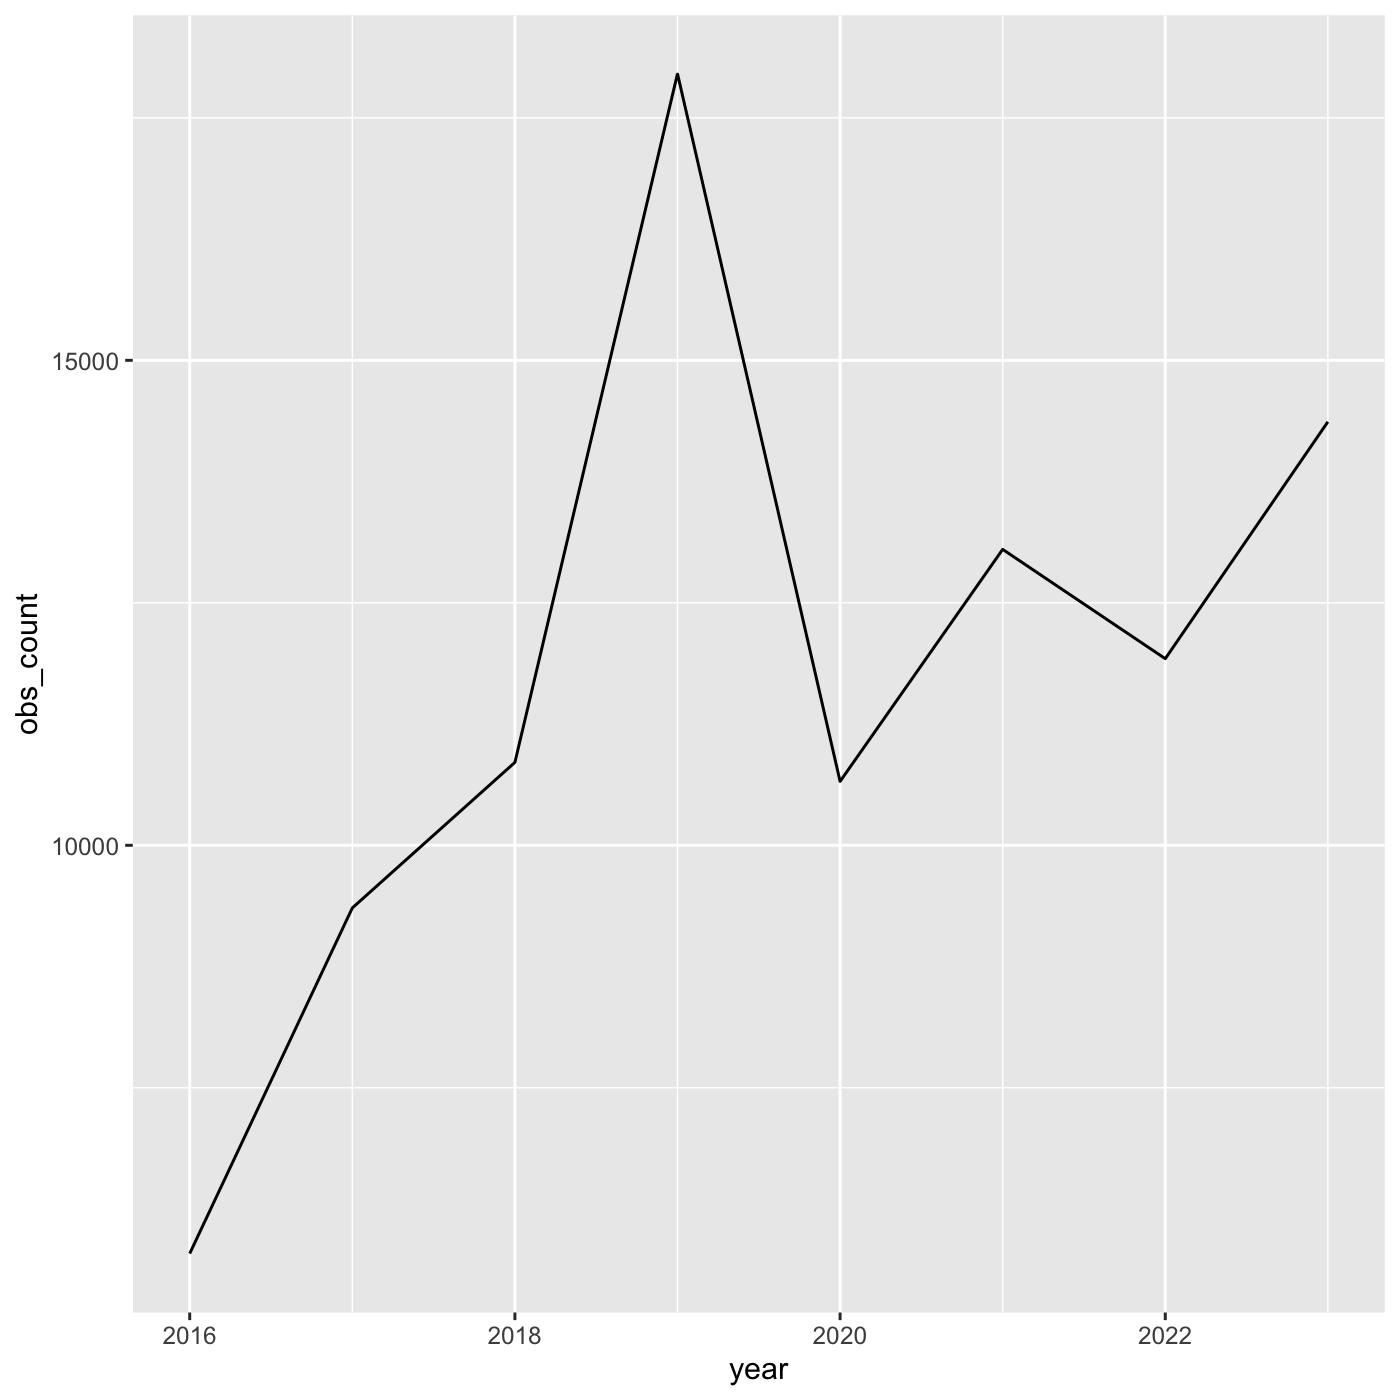
Figure 6
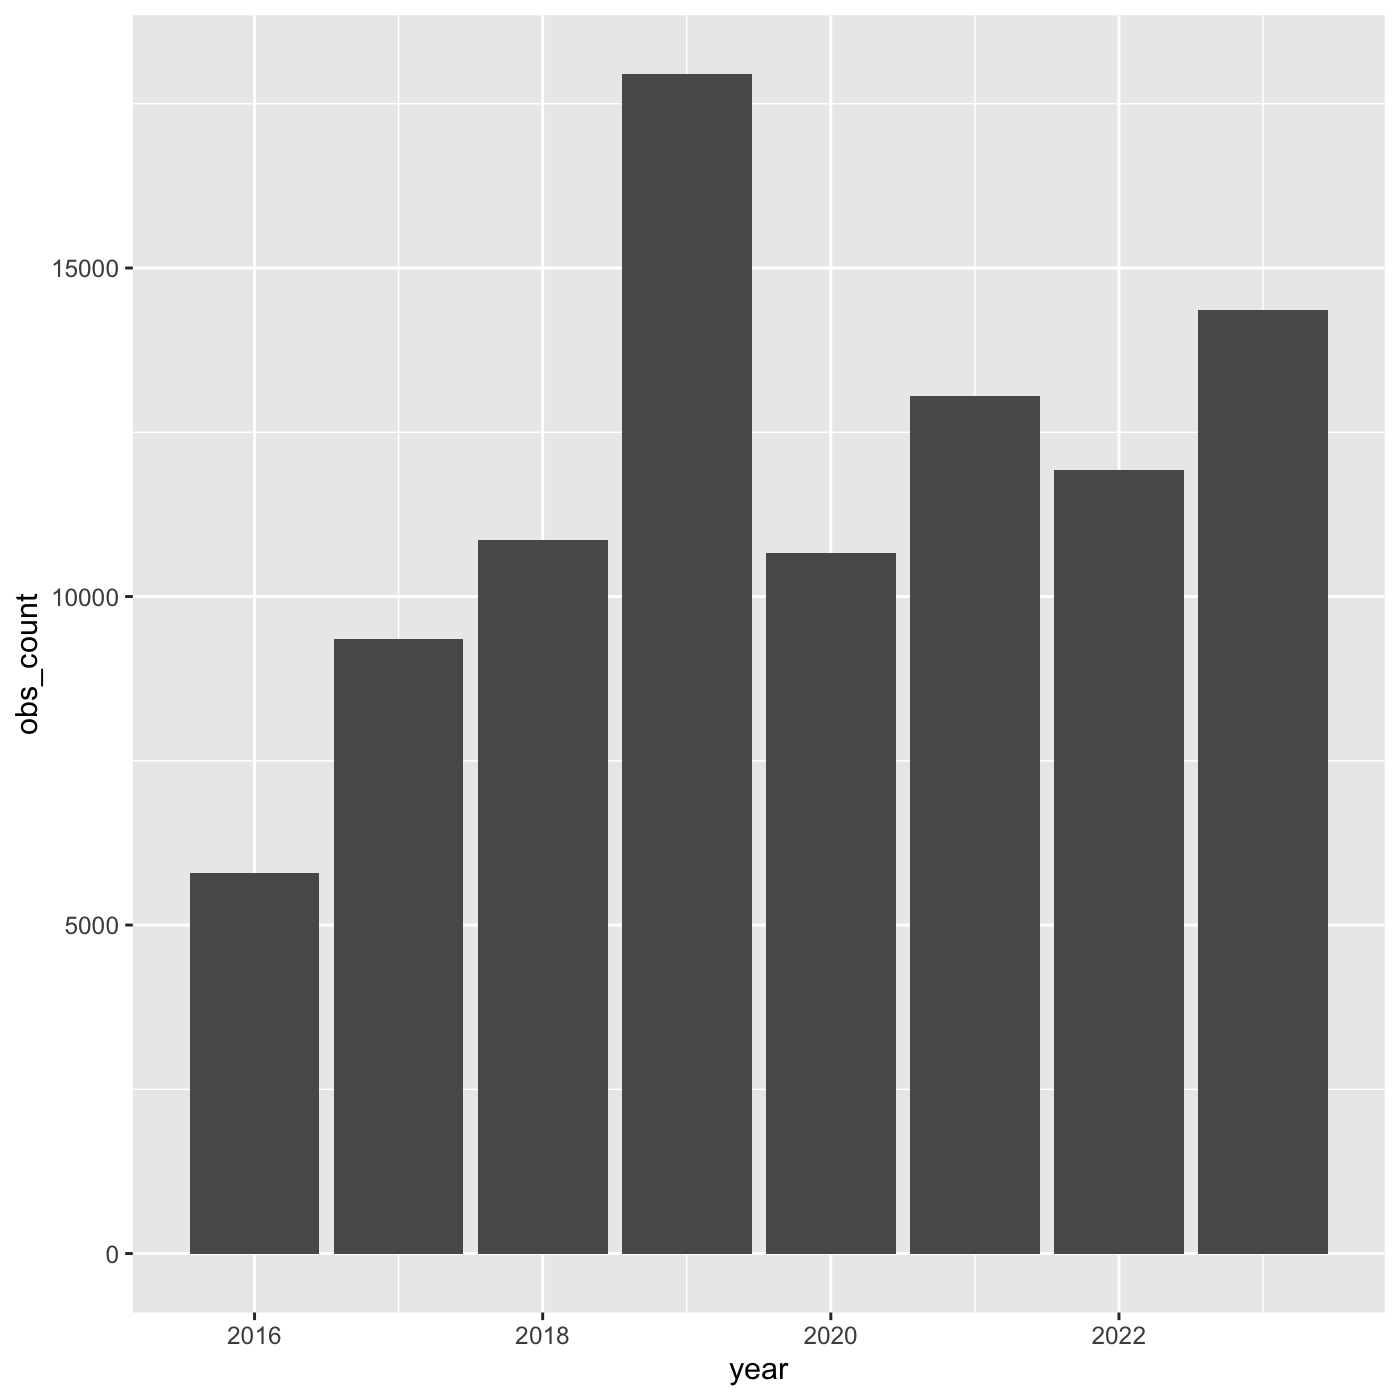
Figure 7
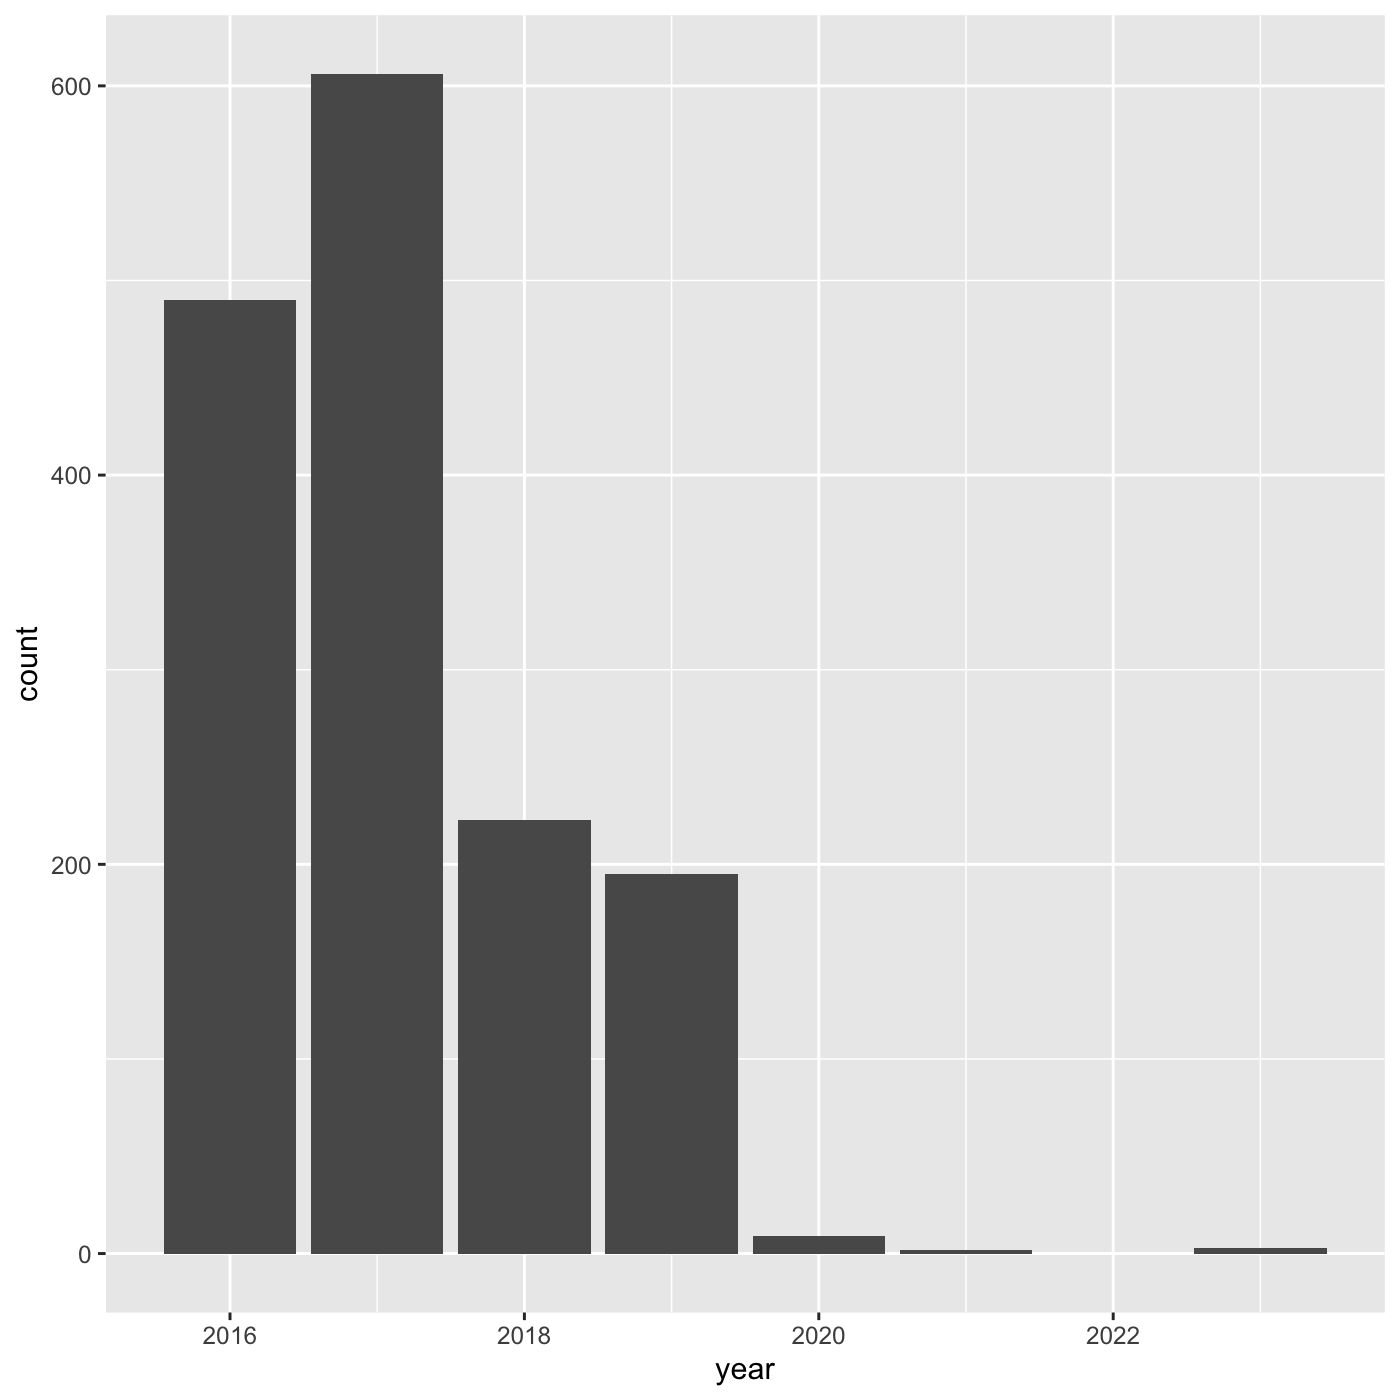
Figure 8
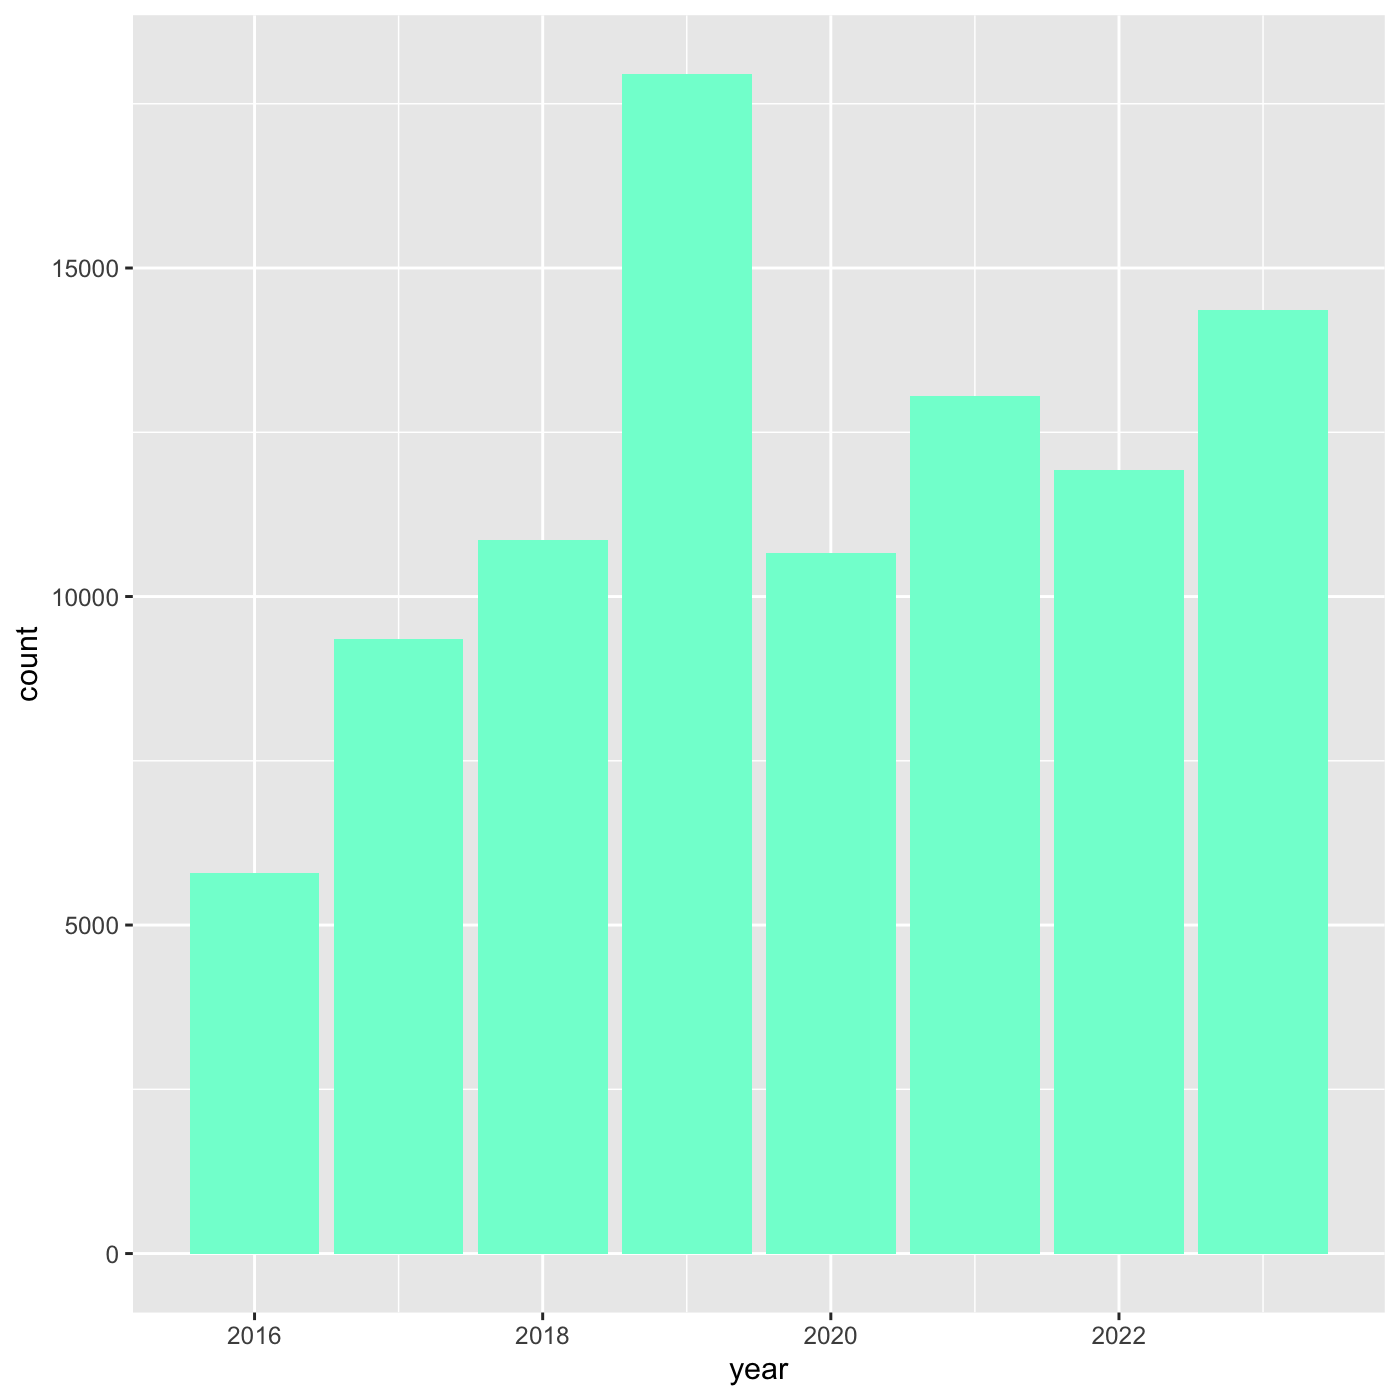 We can also use 6 digit hex color. You can use online tools to get hex
colors. https://html-color.codes
We can also use 6 digit hex color. You can use online tools to get hex
colors. https://html-color.codes
Figure 9

Figure 10
 We create a new dataframe that counts the number observations per year
and iconic_taxon_name. Use
We create a new dataframe that counts the number observations per year
and iconic_taxon_name. Use mutate() and year()
to add a year column. We want count by both
year and iconic_taxon_name. We want the column
to be called obs_count.
Figure 11
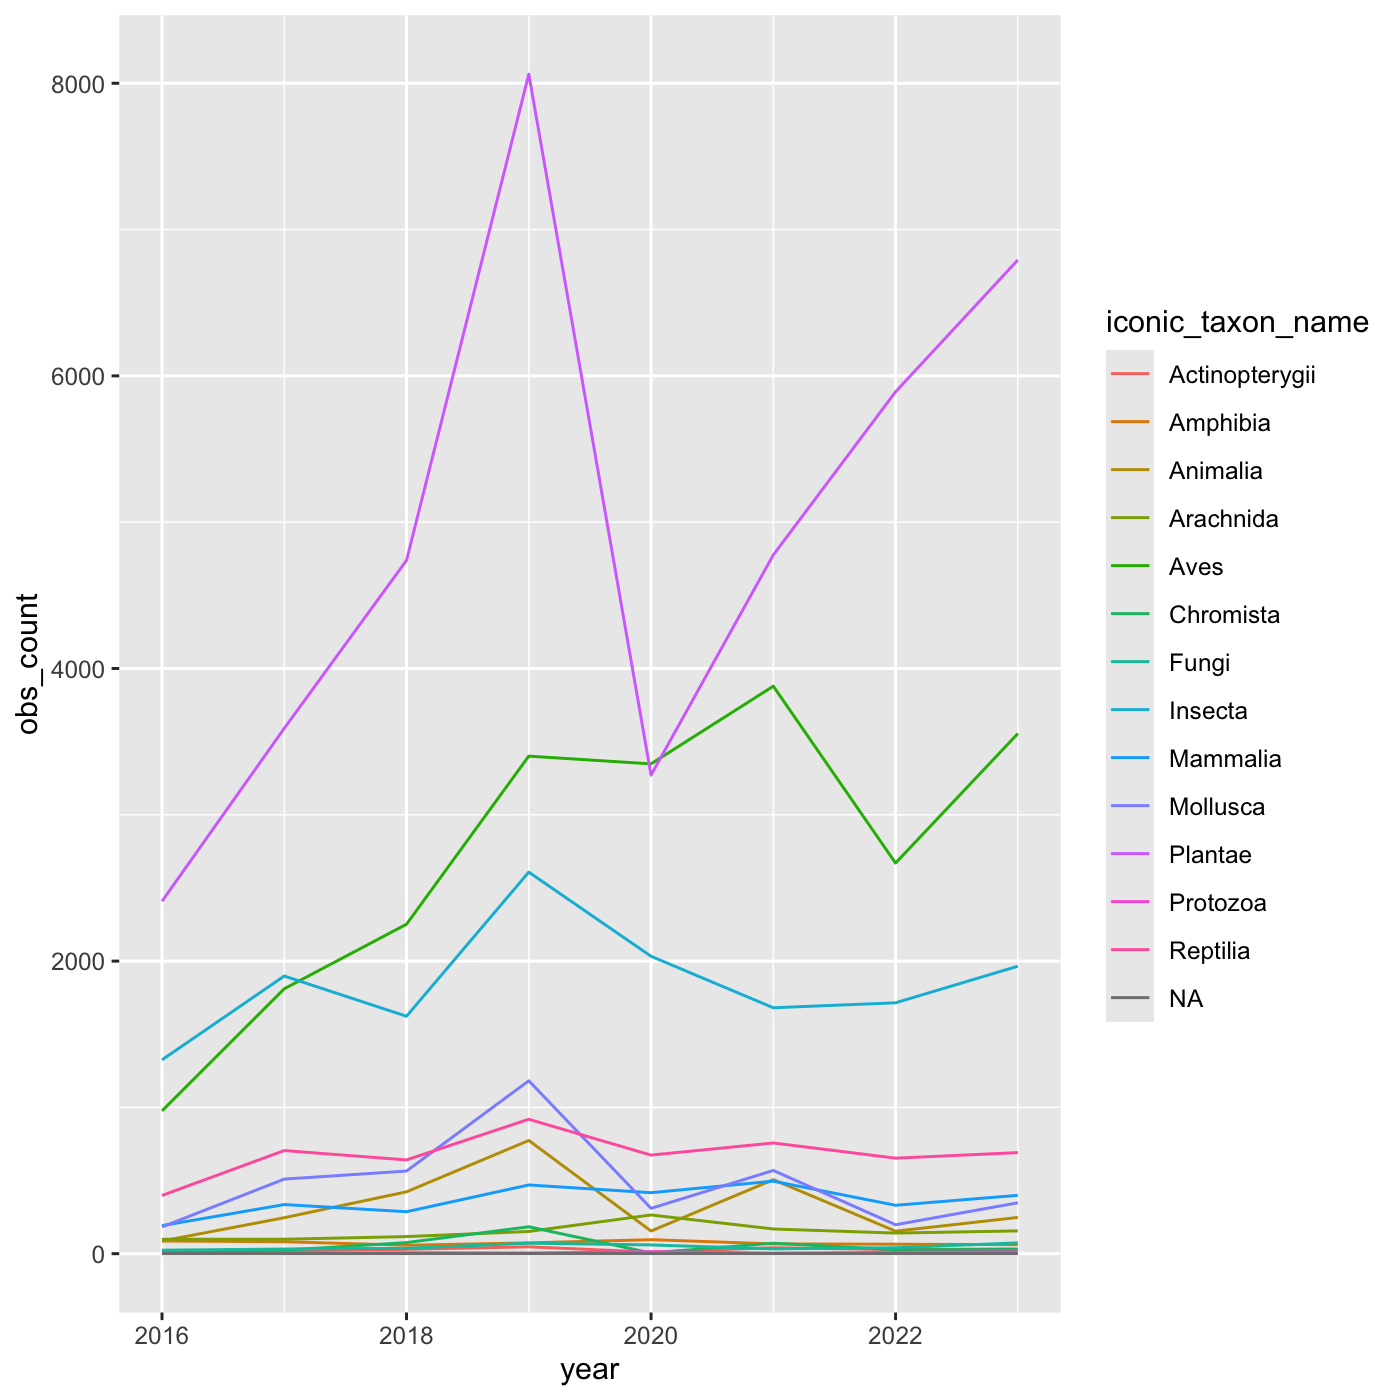
Figure 12
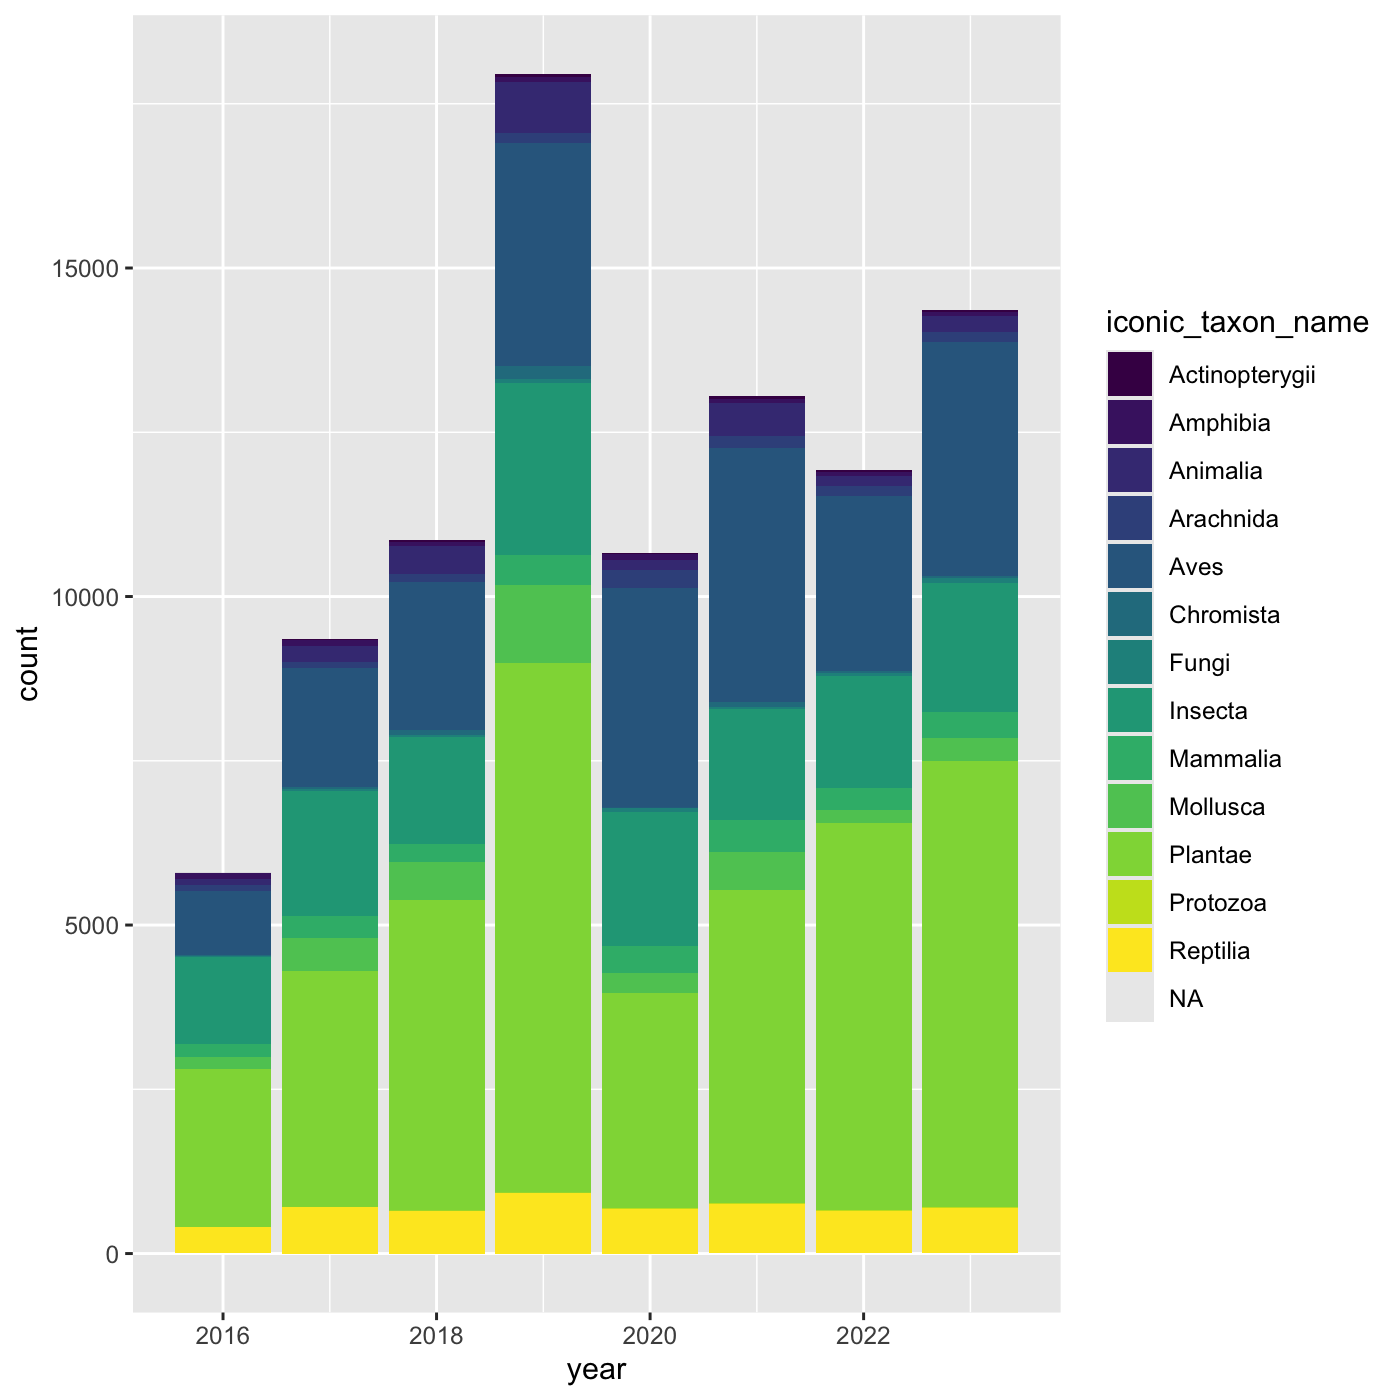
Figure 13
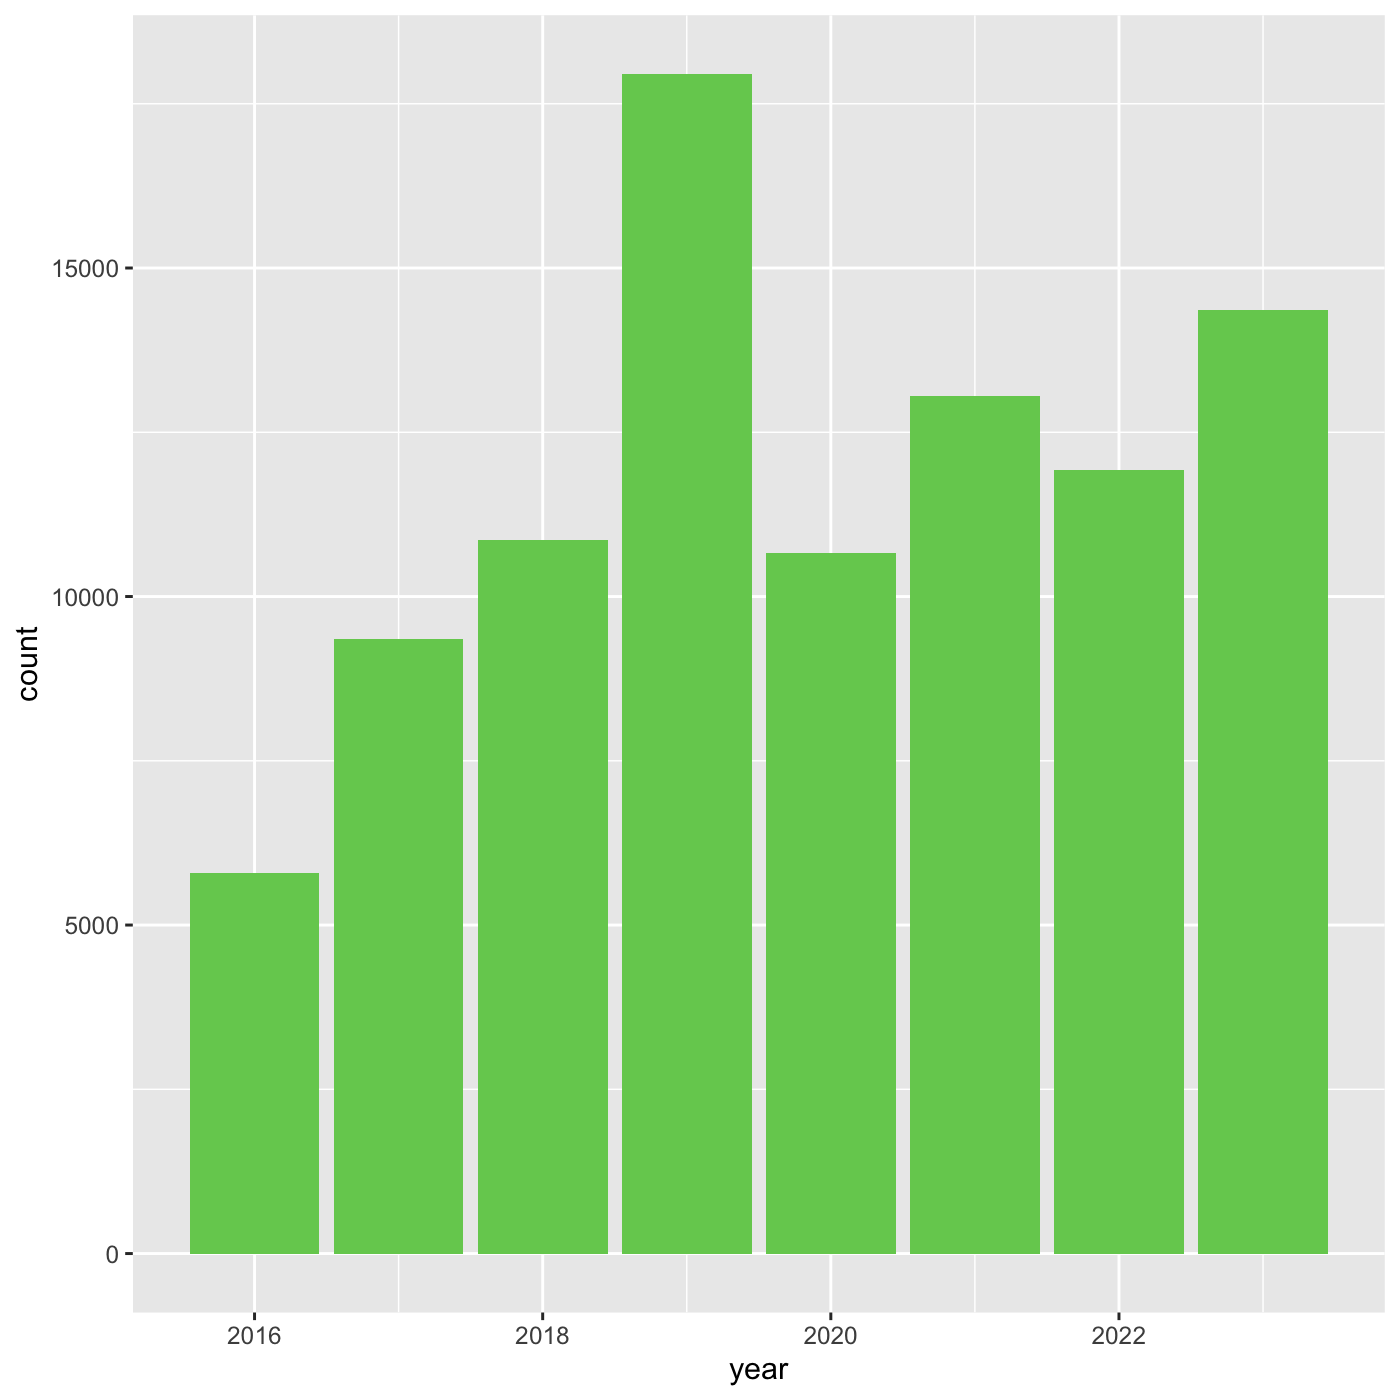
Figure 14

Figure 15
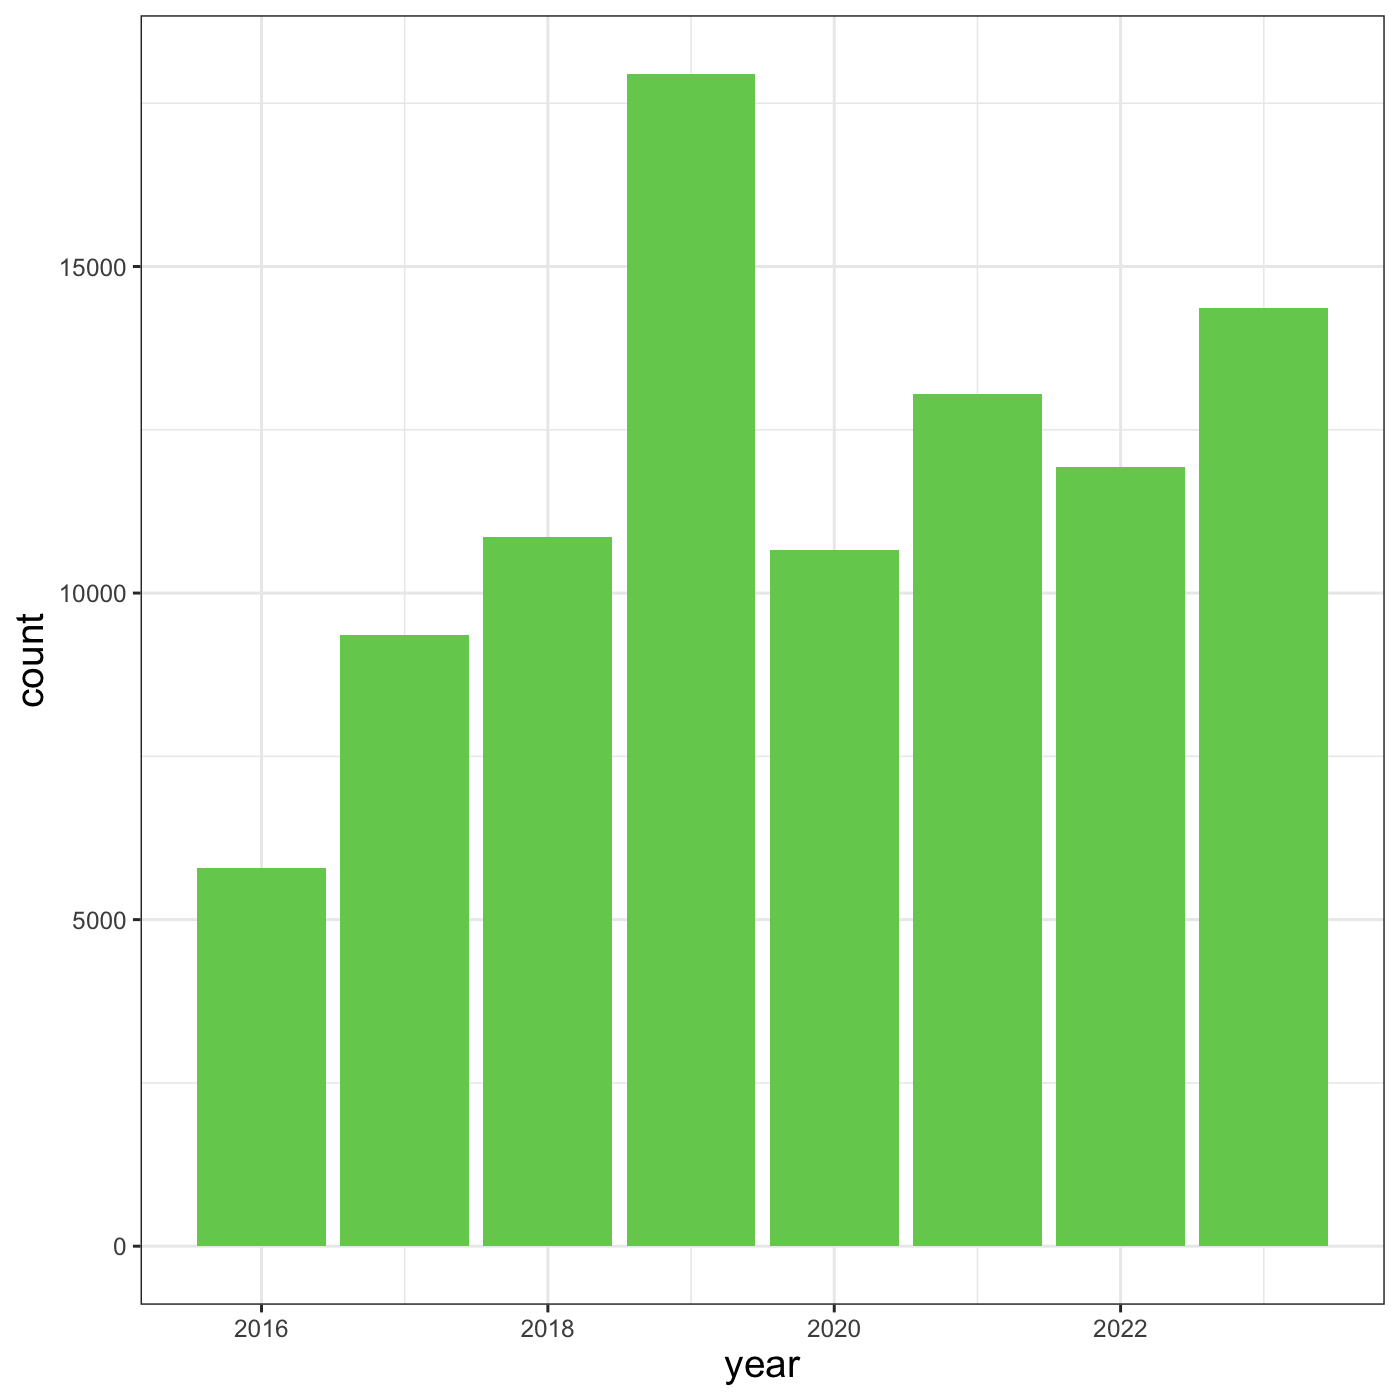
Figure 16
Figure 17
Figure 18
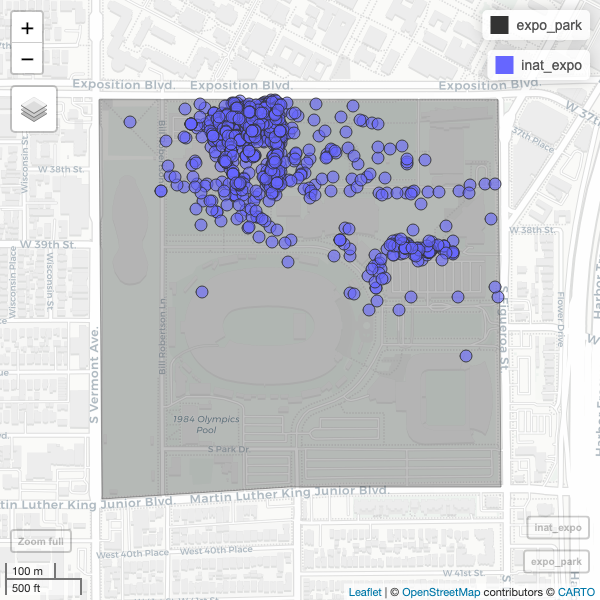
Creating maps
Figure 1
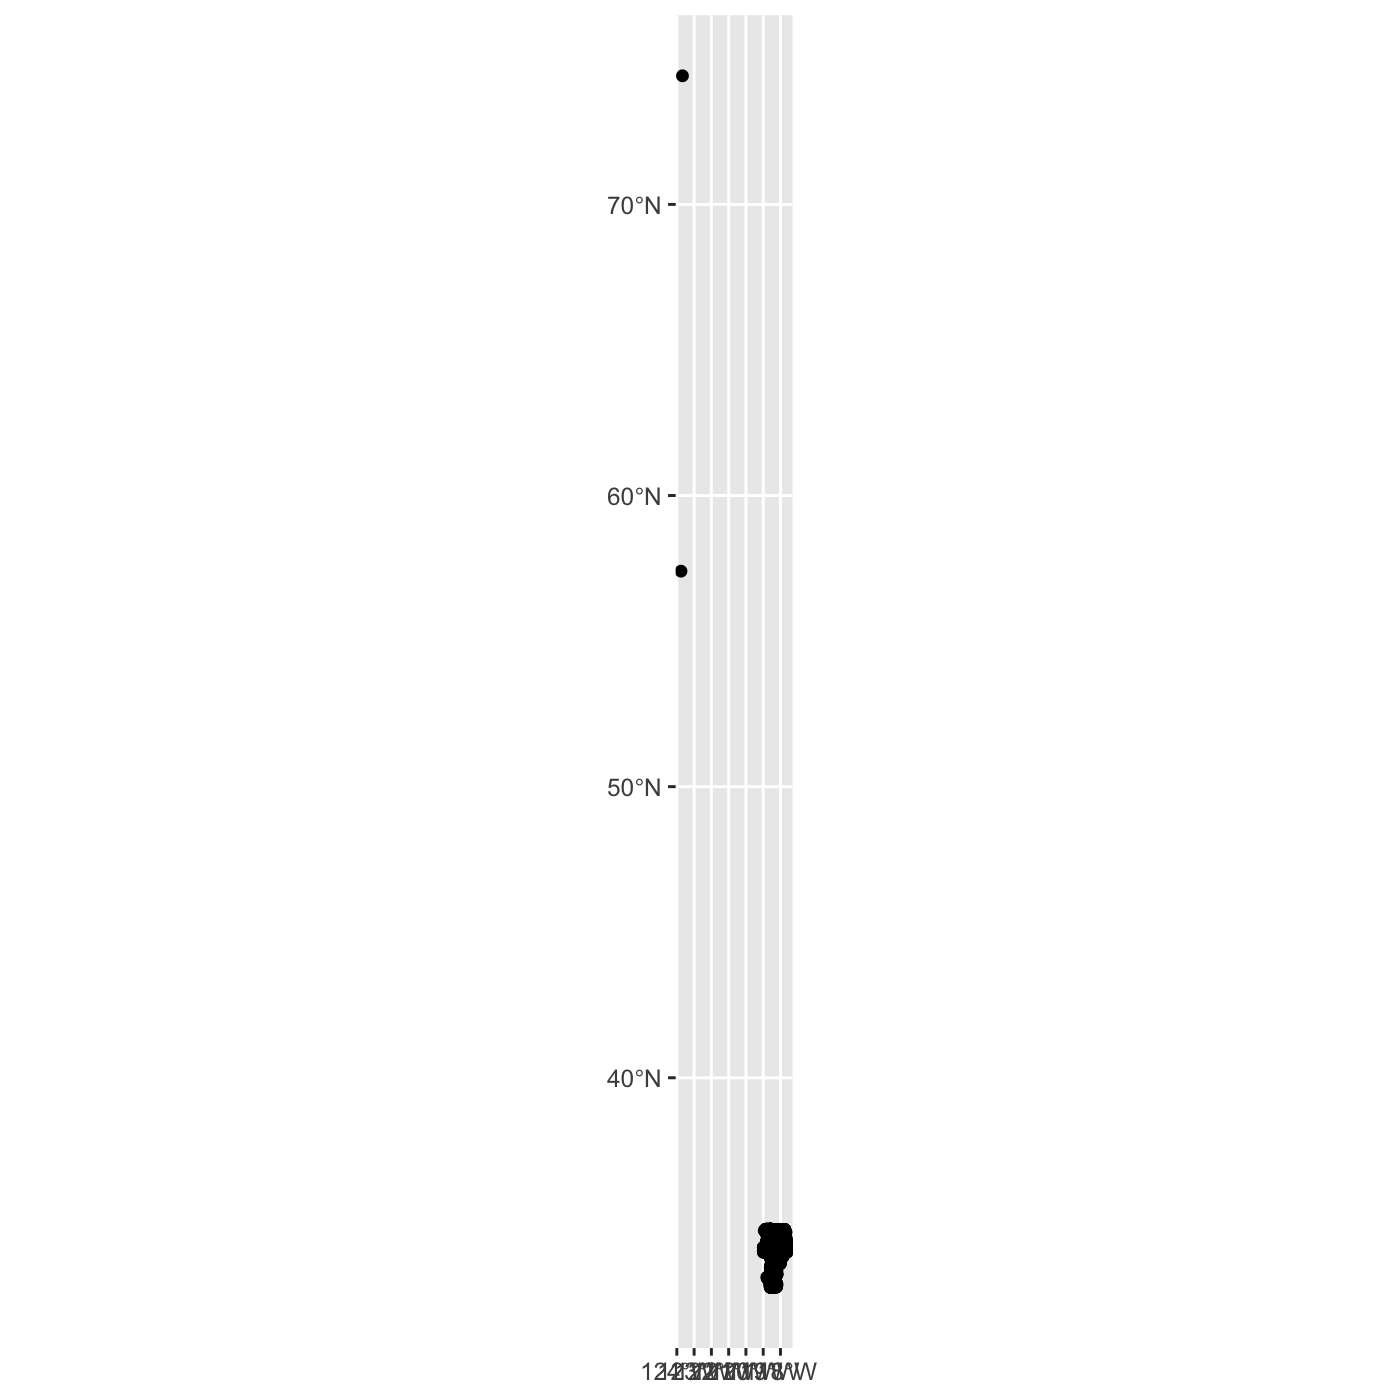 There are some observations that are outside of Los Angeles. Use filter
to select observations in LA.
There are some observations that are outside of Los Angeles. Use filter
to select observations in LA.
Figure 2
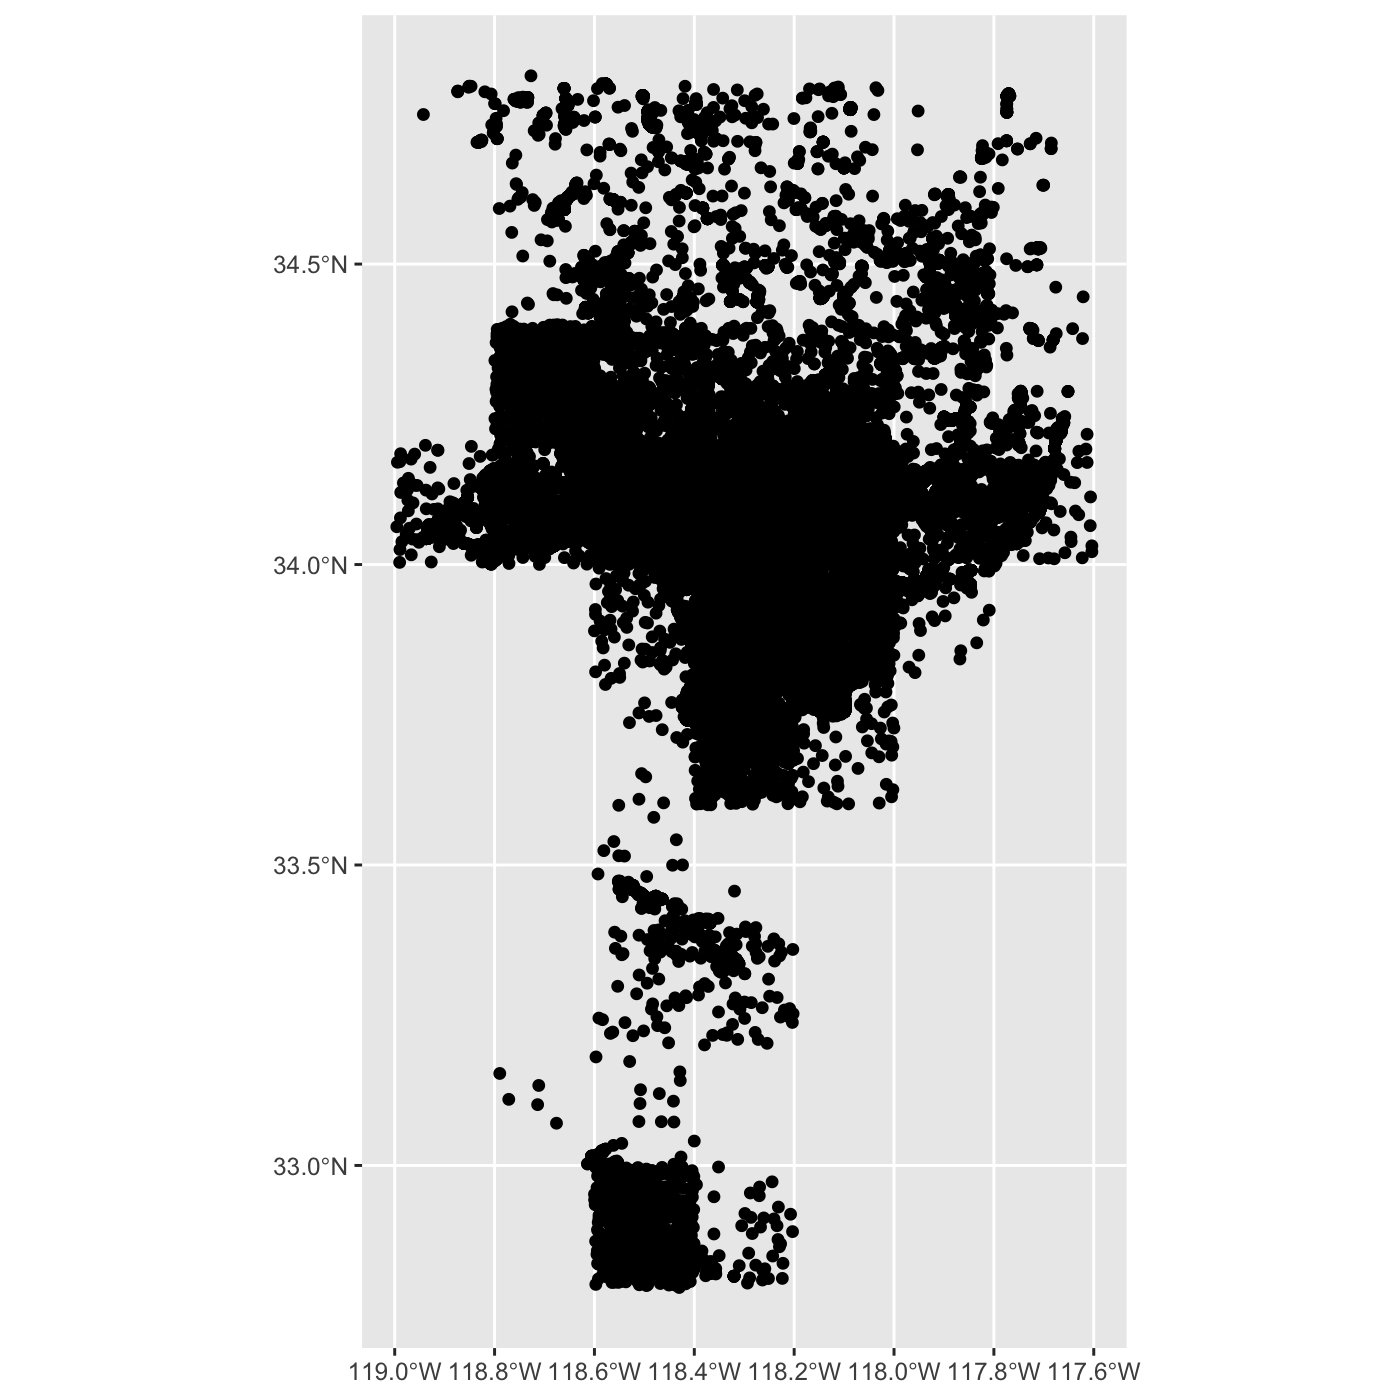
Figure 3
Figure 4
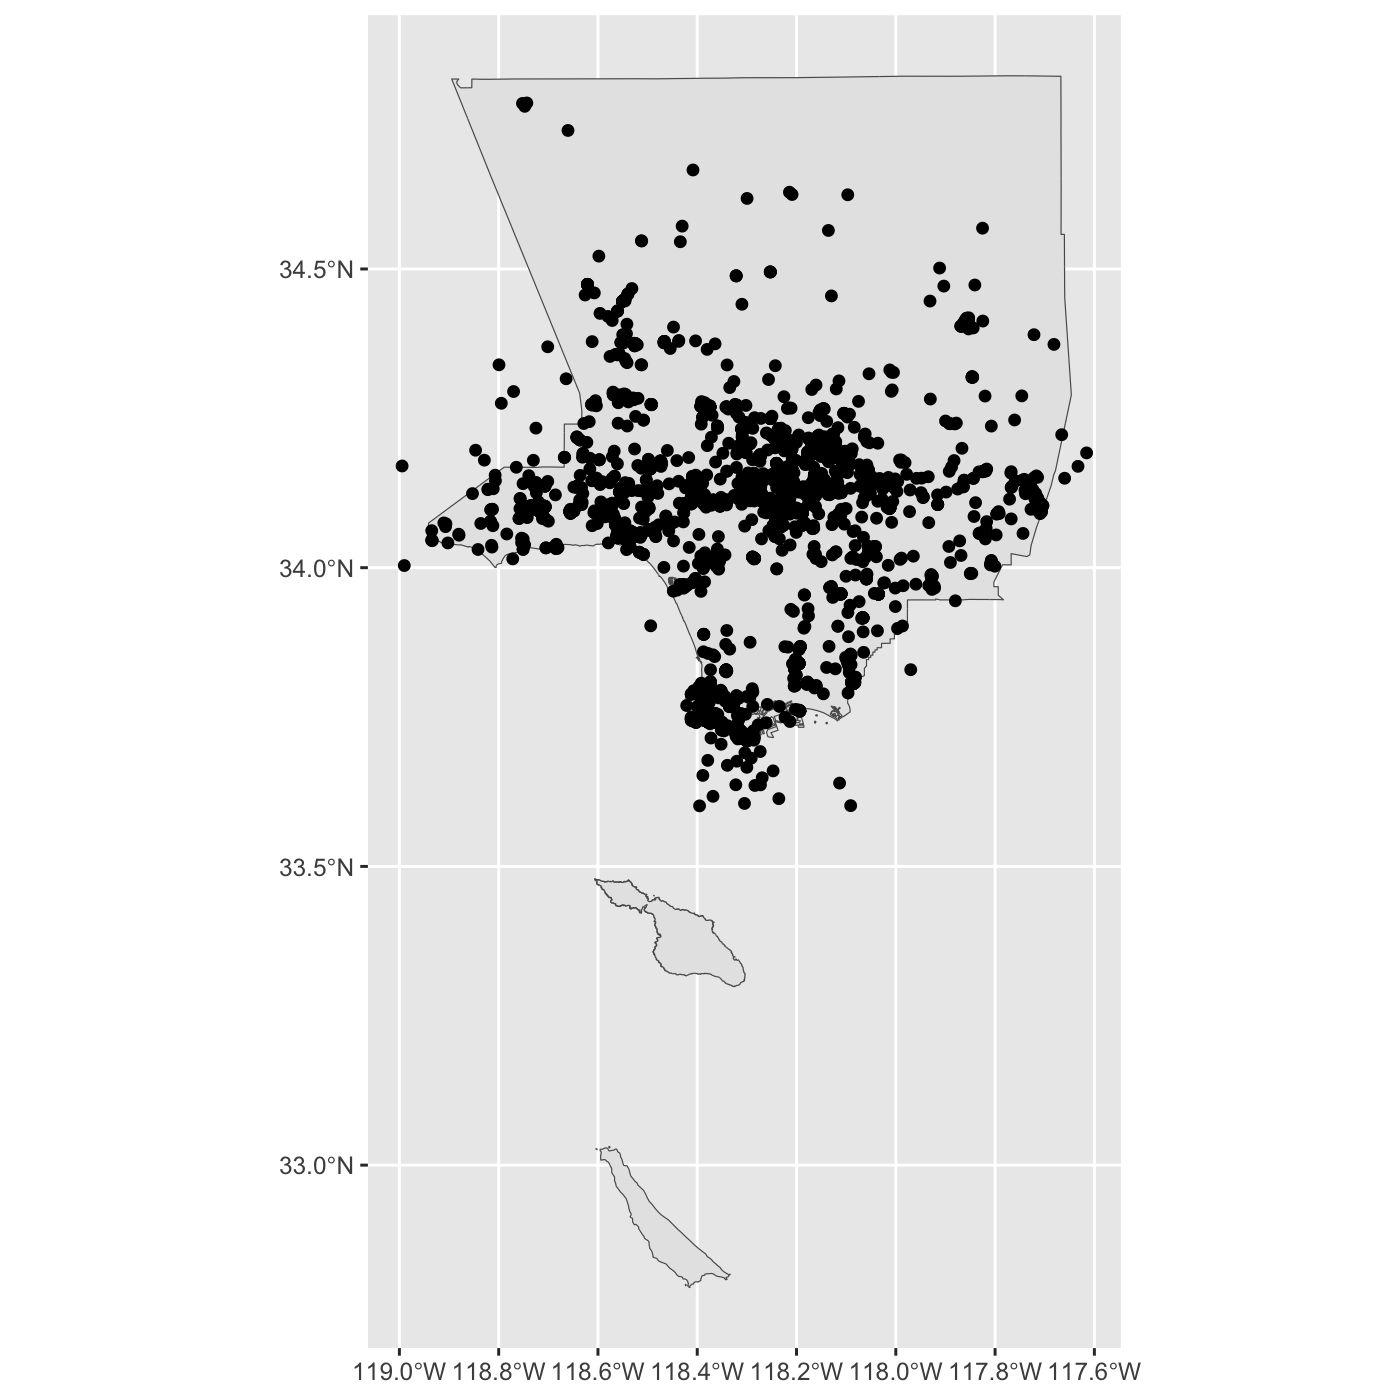
Figure 5
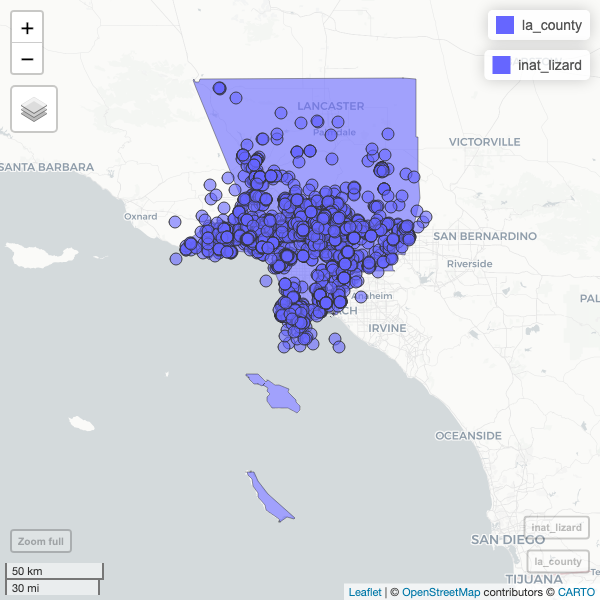
Figure 6
Figure 7
Figure 8
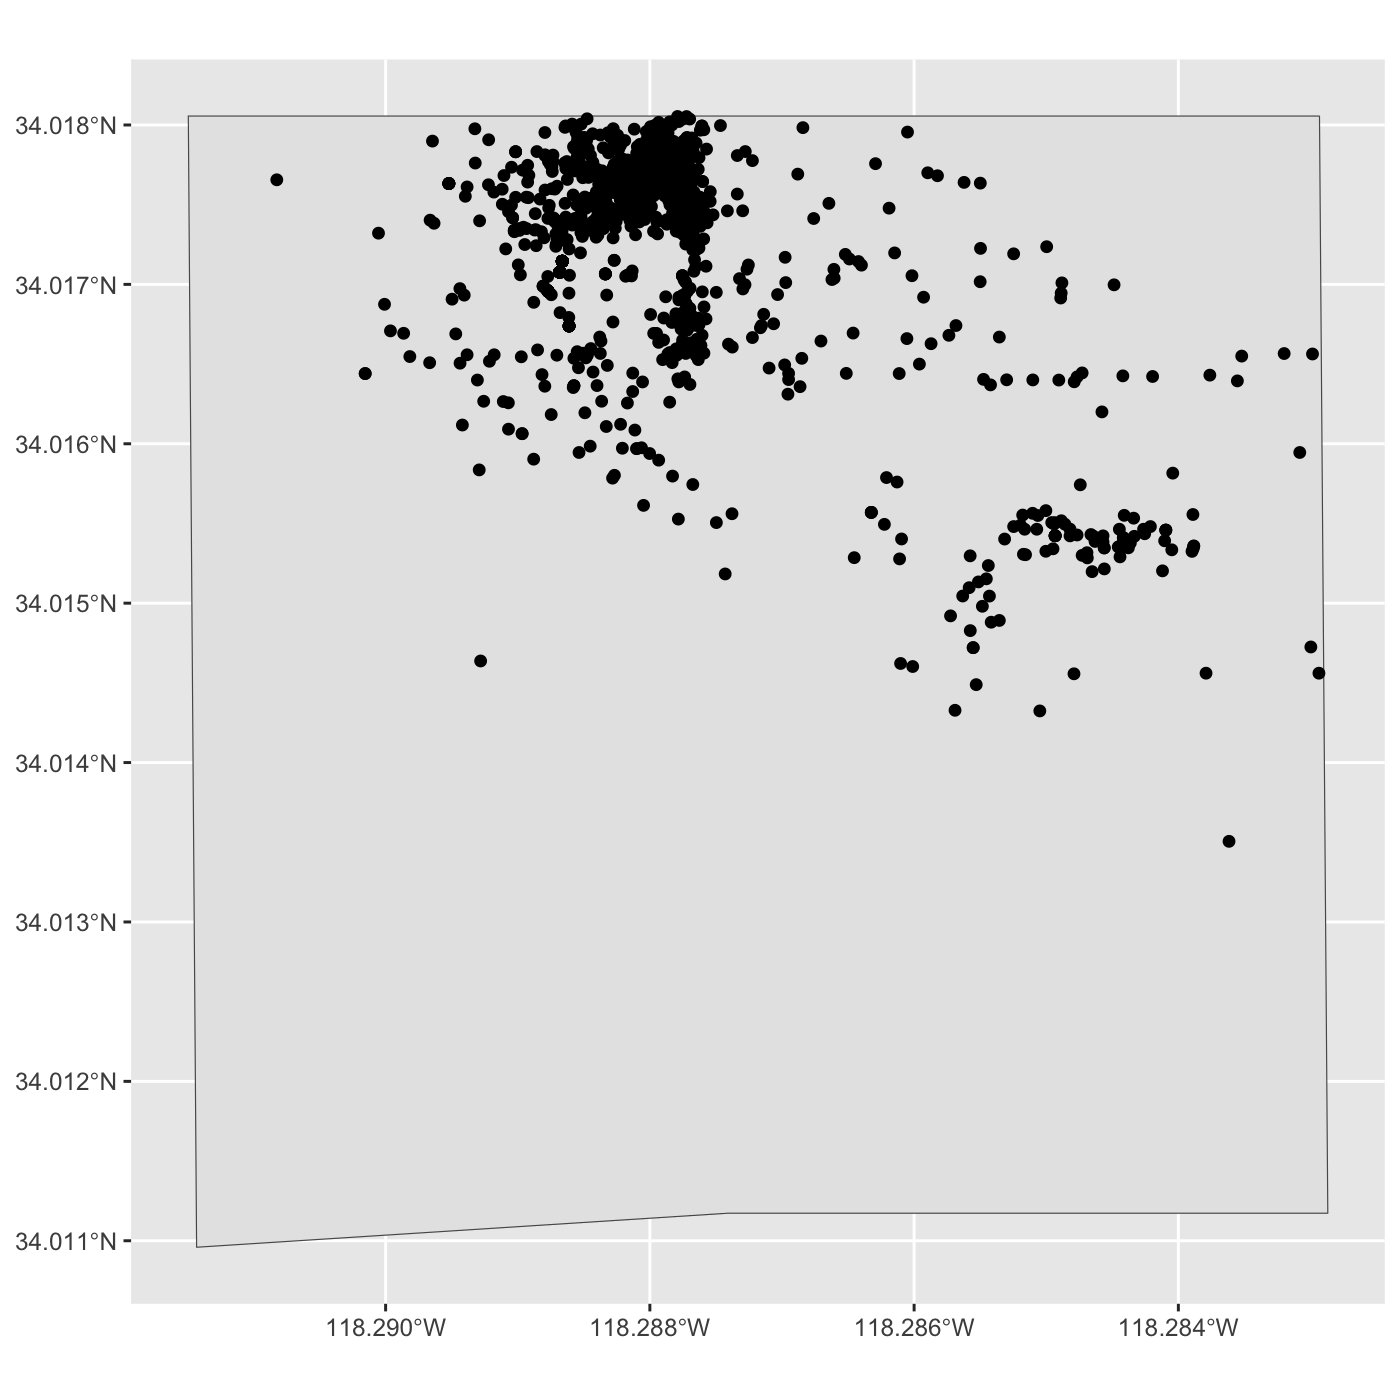
Figure 9
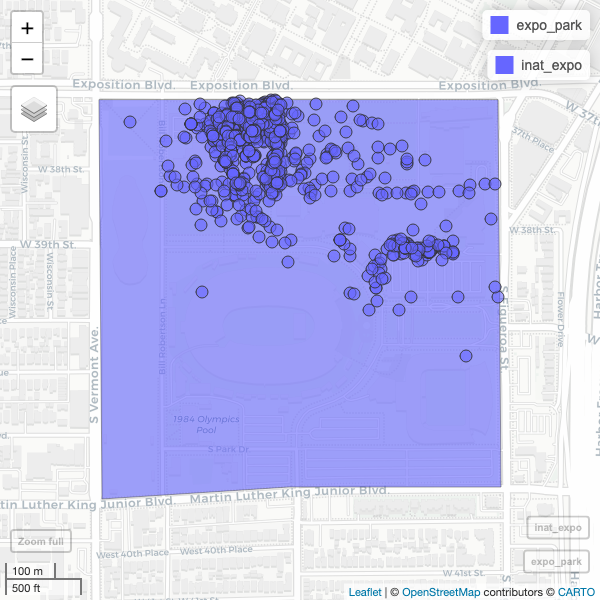
Figure 10