Content from Using mapview
Last updated on 2024-12-15 | Edit this page
R
inat <- read.csv("data/inat-observations.csv")
R
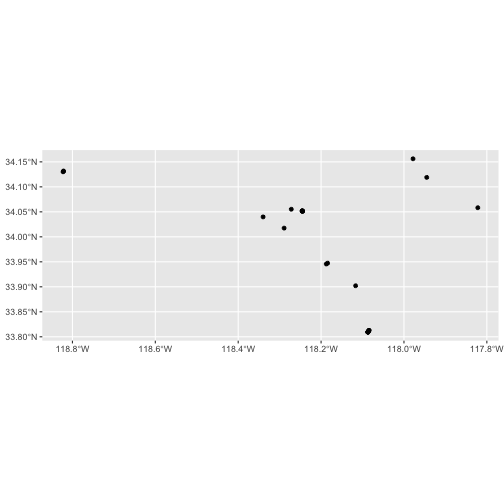
map_locations <- st_as_sf(inat, coords = c("longitude", "latitude"), crs = 4326)
ggplot() +
  geom_sf(data = map_locations)
R
map_data <- inat %>%
  st_as_sf(coords = c("longitude", "latitude"),   crs = 4326, remove=FALSE)


mapview(map_data)
This is end of the map.